


158
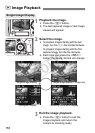
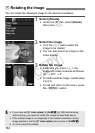
x Image Playback
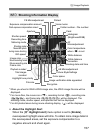
About the AF Point Display
When the [
4
AF point disp.
] menu option is set to [
Enable
], the AF
point which achieved focus will be displayed in red. If automatic AF
point selection was used, multiple AF points might be displayed in red.
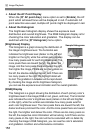
About the Histogram
The brightness histogram display shows the exposure level
distribution and overall brightness. The RGB histogram display is for
checking the color saturation and gradation. The display can be
switched with the [4 Histogram] menu option.
[Brightness] Display
This histogram is a graph showing the distribution of
the image’s brightness level. The horizontal axis
indicates the brightness level (darker on the left and
brighter on the right), while the vertical axis indicates
how many pixels exist for each brightness level. The
more pixels there are toward the left, the darker the
image. And the more pixels there are toward the right,
the brighter the image. If there are too many pixels on
the left, the shadow detail will be lost. And if there are
too many pixels on the right, the highlight detail will
be lost. The gradation in-between will be reproduced.
By checking the image and its brightness histogram,
you can see the exposure level inclination and the overall gradation.
[RGB] Display
This histogram is a graph showing the distribution of each primary color’s
brightness level in the image (RGB or red, green, and blue). The horizontal
axis indicates the color’s brightness level (darker on the left and brighter
on the right), while the vertical axis indicates how many pixels exist for
each color brightness level. The more pixels there are toward the left, the
darker and less prominent the color. And the more pixels there are toward
the right, the brighter and denser the color. If there are too many pixels on
the left, the respective color information will be lacking. And if there are too
many pixels on the right, the color will be too saturated with no detail. By
checking the image’s RGB histogram, you can see the color’s saturation
and gradation condition and white balance inclination.
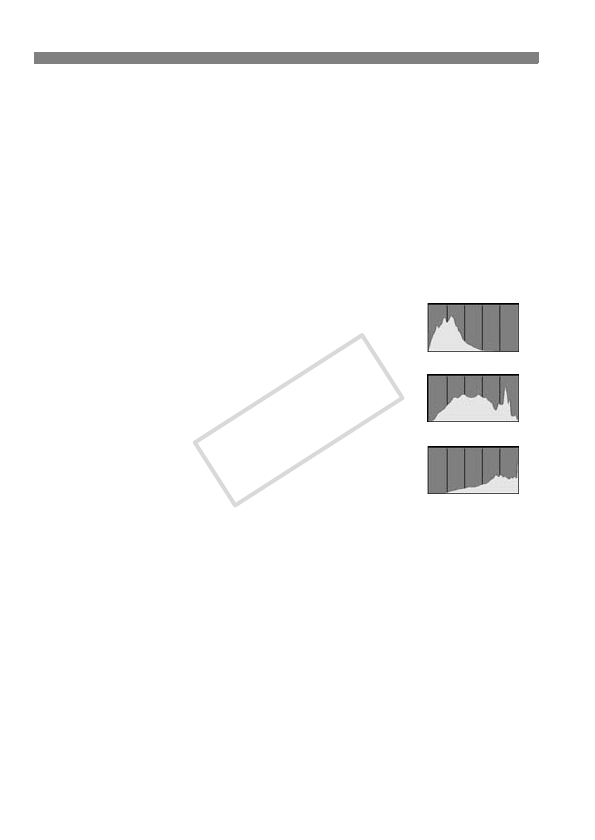
Sample Histograms
Dark image
Normal brightness
Bright image
COPY