


13-77
User Guide for Cisco Secure Access Control System 5.3
OL-24201-01
Chapter 13 Managing Reports
Understanding Charts
Changing Chart Subtype
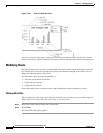
charts have subtypes, which you can change as needed:
• Bar chart—Side-by-Side, Stacked, Percent Stacked
• Line chart—Overlay, Stacked, Percent Stacked
• Area chart—Overlay, Stacked, Percent Stacked
• Meter chart—Standard, Superimposed
• Stock chart—Candlestick, Bar Stick
Many chart types offer two-dimensional subtypes, in which the chart shape appears flat against the chart
background. Some charts also can be displayed with depth. A chart with depth appears to have added
dimension. To do this:
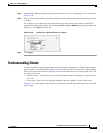
Step 1 Right-clicking the chart whose subtype you want to modify.
Step 2 Select Chart Subtype.
The Chart Subtype dialog box appears.
Step 3 Select the desired chart subtype.
Changing Chart Formatting
Some of the formatting for a chart, such as the colors of the bars in a bar chart and the background color
of the chart, comes from the report template or the theme.
When viewing the report you can modify other items of the chart’s format, including the fonts and font
sizes of the chart title and axis labels, and the height and width of the chart. You can hide axis labels,
place labels at an angle relative to the axis, and hide the legend or determine where to display the legend
in relation to the chart.
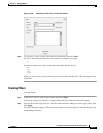
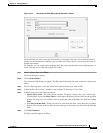
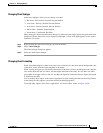
You can modify other aspects of the chart’s appearance by right-clicking the chart and choosing Format.
In the dialog box that appears, choose the desired formatting properties.
To modify other aspects of the chart’s appearance, use Format Chart, shown in Figure 13-50.