


KODAK VISION2 500T Color Negative Film 5218 / 7218 / SO-218 • H-1-5218t 3
FILM-TO-VIDEO TRANSFERS
When you transfer the film directly to video, you can set up
the telecine using KODAK Telecine Analysis Film (TAF)
supplied by Eastman Kodak Company. The TAF consists of
a neutral density scale and an eight-bar color test pattern with
a LAD gray surround.
The TAF gray scale provides the telecine operator
(colorist) with an effective way to adjust subcarrier balance
and to center the telecine controls before timing and
transferring a film. The TAF color bars provide the utility of
electronic color bars, even though they do not precisely
match the electronically generated color bars. Using the
TAF will help obtain optimum quality and consistency in
the film-to-video transfer. For more information regarding
TAF, see KODAK Publication No. H-9, TAF User's Guide.
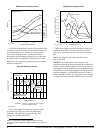
IMAGE STRUCTURE
The modulation-transfer and diffuse rms granularity curves
were generated from samples of 5218 Film exposed with
tungsten light and processed as recommended in Process
ECN-2 chemicals. For more information on image-structure
characteristics, see KODAK Publication No. H-1, KODAK
Motion Picture Film available online at http://
www.kodak.com/US/en/motion/support/h1.
MTF
The "perceived" sharpness of any film depends on various
components of the motion picture production system. The
camera and projector lenses and film printers, among other
factors, all play a role. But the specific sharpness of a film
can be measured and charted in the Modulation Transfer
Curve.
rms Granularity:
Refer to curve.
Read with a microdensitometer, (red, green, blue) using a
48-micrometer aperture.
The "perception" of the graininess of any film is highly
dependent on scene content, complexity, color, and density.
Other factors, such as film age, processing, exposure
conditions, and telecine transfer may also have significant
effects.
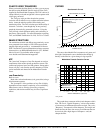
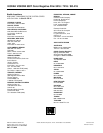
CURVES
Sensitometric Curves
The curves describe this film's response to red, green, and
blue light. Sensitometric curves determine the change in
density on the film for a given change in log exposure.
4
Modulation-Transfer Function Curves
This graph shows a measure of the visual sharpness of this
film. The x-axis, "Spatial Frequency," refers to the number
of sine waves per millimeter that can be resolved. The y-axis,
"Response," corresponds to film sharpness. The longer and
flatter the line, the more sine waves per millimeter that can
be resolved with a high degree of sharpness—and, the
sharper the film.
F010_0220AC
6.0
CAMERA STOPS
7.0
0.0
4.0
DENSITY
1.0
2.0
3.0
1.0 2.0
Densitometry:
Exposure:
Process:
ECN-2
3200 K Tungsten 1/50 sec
Status M
B
G
R
5.05.0
6.0 2.03.0 0.0 1.0 3.0 4.0
4.0
3.0 2.0 1.0
LOG EXPOSURE (lux-seconds)
0.0
1001 2 3 4 5 10 20 50 200 600
SPATIAL FREQUENCY (cycles/mm)
RESPONSE (%)
10
1
2
5
3
7
30
20
100
70
50
200
R
G
B
Densitometry:
Process:
Exposure:
3200 K Tungsten
ECN-2
Status M
F010_0217AC