


RECIPROCITY
No filter corrections or exposure
adjustments for exposure times from
1/1000 of a second to 1/10 second. In the
1-second range, increase exposure
2/3 stop and use a KODAK Color
Compensating Filter CC 10Y. In the
10 second range, increase exposure 1
stop and use a KODAK Color
Compensating Filter CC 20Y.
I
DENTIFICATION
After processing, the Kodak internal
product code symbol (EB), product code
numbers 5229 (35 mm) or 7229 (16 mm),
emulsion and roll number identification,
and EASTMAN KEYKODE Numbers are
visible along the length of the film.
G
RAIN
The perception of graininess of any film
depends on scene content, complexity,
color, and density. In KODAK VISION2
Expression 500T Color Negative Film
5229 / 7229, the measured granularity
is exceptionally low.
S
HARPNESS
The perceived sharpness of any film
depends on various components of the
motion picture production system.
Camera and projector lenses, film printers,
and other factors play a role, but the
specific sharpness of a film can be
measured and charted in the Modulation
Transfer Curve.
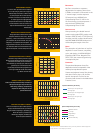
SENSITOMETRIC CURVES ➤
"0" on the x-axis represents normal exposure
of an 18-percent gray card in the red, green,
and blue layers of this film. A white card is
2 1/3 stops higher than normal exposure,
and there are at least 2 1/2 stops above that
for capturing specular highlight detail.
A 3-percent black card is 2 2/3 stops below
normal exposure. There are at least 2 1/2
stops of latitude below that for capturing
shadow detail.
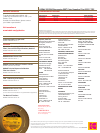
MODULATION-TRANSFER CURVES ➤
This graph shows a measure of the visual
sharpness of this film. The x-axis, “Spatial
Frequency,” refers to the number of sine waves
per millimetre that can be resolved. The y-axis,
“Response,” corresponds to film sharpness. The
longer and flatter the line, the more sine waves
per millimetre that can be resolved with a high
degree of sharpness—and the sharper the film.
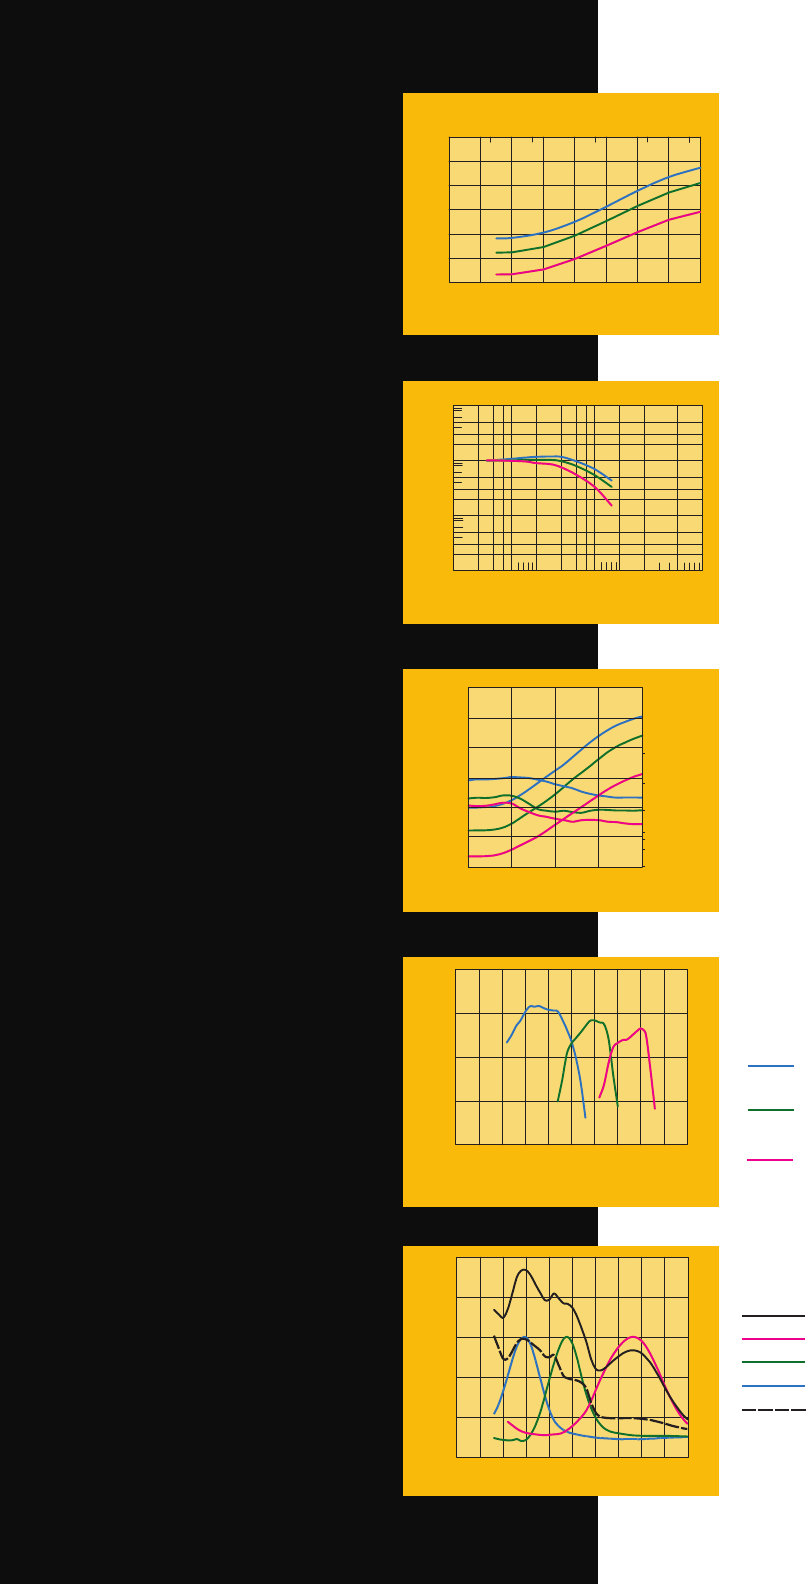
DIFFUSE RMS GRANULARITY CURVES ➤
To find the rms granularity value for a given
density, find the density on the left vertical scale
and follow horizontally to the sensitometric
curve and then go vertically (up or down) to the
granularity curve. At that point, follow
horizontally to the Granularity Sigma D scale
on the right. Read the number and multiply
by 1000 for the rms value.
SPECTRAL-SENSITIVITY CURVES ➤
These curves depict the sensitivity of this film to
the spectrum of light. They are useful for
determining, modifying, and optimizing
exposure for blue- and green-screen
special-effects work.
SPECTRAL DYE-DENSITY CURVES ➤
These curves depict the spectral absorptions of
the dyes formed when the film is processed.
They are useful for adjusting or optimizing any
device that scans or prints the film.
NOTE: Cyan, Magenta, and Yellow Dye
Curves are peak-normalized.
Spectral Sensitivity Curve Key
Spectral Dye Density Curve Key
Sensitivity of the yellow dye
forming layer
Sensitivity of the magenta dye
forming layer
Sensitivity of the cyan dye
forming layer
Midscale Neutral
Cyan Dye
Magenta Dye
Yellow Dye
Minimum Density
Note: Sensitometric and Diffuse RMS Granularity curves are produced on different equipment.
A slight variation in curve shape may be noticed.
-0.2-1-2-3.2-4
0.0
1.0
2.0
3.0
-10 -8 -6 -4 -2 0 2 4 6
CAMERA STOPS
DENSITY
LOG EXPOSURE (lux seconds)
.01
.001
.002
.003
.004
.10
.03
Granularity SIGMA D
0.0 1.0 2.0 3.0 4.0
0.0
DENSITY
1.0
2.0
3.0
LOG EXPOSURE (lux-seconds)
1
10
100
1000
1 10 1000100
SPATIAL FREQUENCY (cycles/mm)
RESPONSE (%)
700 750650600550500450400350300250
0.0
1.0
2.0
3.0
4.0
LOG SENSITIVITY
WAVELENGTH (nm
to produce specified density
*Sensitivity = reciprocal of exposure (erg/cm ) require
)
2
d
*
1.8
1.4
1.0
0.6
0.2
700 750 800400 450 500 550
-0.2
300 350
WAVELENGTH (nm)
600 650
DIFFUSE SPECTRAL DENSITY
61967-Broch 10/6/05 8:24 PM Page 3