


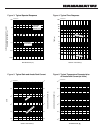
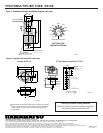

Figure 2: Typical Spatial Uniformity
TPMSB0066EA
Y
X
100
80
60
40
20
0
8404
8
RELATIVE SENSITIVITY (%)
DISTANCE FROM CENTER OF
PHOTOCATHODE (mm)
RELATIVE SENSITIVITY (%)
100
80
60
40
20
0
9
4.5
0
9
4.5
DISTANCE FROM CENTER OF
PHOTOCATHODE (mm)
SPOTSIZE : 1mm DIA
SUPPLY VOLTAGE : 1000V
WAVELENGTH : 400nm
X-Axis
Y-Axis
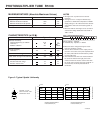
Supply Voltage
Between Anode and Cathode
Between Anode and Last Dynode
1500
250
0.1
Vdc
Vdc
mA
Average Anode Current
A
CHARACTERISTlCS (at 25 )
NOTES
Cathode Sensitivity
Anode Dark Current
D
(after 30min. storage in the darkness)
A:
B:
C:
Averaged over any interval of 30 seconds
maximum.
The light source is a tungsten filament lamp
operated at a distribution temperature of 2856K.
Supply voltage is 150 volts between the cathode
and all other electrodes connected together as
anode.
Measured with the same light source as Note B
and with the voltage distribution ratio shown in
Table 1 below.
Radiant at 800nm
Anode Pulse Rise Time
E
Electron Transit Time
F
Time Response
Electrodes K Dy1 Dy2 Dy3 Dy4 Dy5 Dy6 Dy7 Dy8 Dy9 P
Ratio
1111111111
SuppIy Voltage : 1250Vdc
K : Cathode, Dy : Dynode, P : Anode
Quantum Efficiency at 1060nm 0.04
Gain
C
3.0 10
5
MAXIMUM RATINGS (Absolute Maximum Values)
Parameter Value Unit
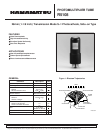
PHOTOMULTlPLlER TUBE R5108
Luminous
B
10
2.2
25
Table 1:Voltage Distribution Ratio
Parameter Typ.Min. Max. Unit
Anode Sensitivity
Luminous
C
1.2
18
mA/W
ns
ns
A/lm
%
nA
3.5 7.5
1000350
A/lm
D:
E:
F:
Measured at the voltage which gives anode
luminous sensitivity of 4A/lm.
The rise time is the time for the output pulse to
rise from 10% to 90% of the peak amplitude when
the entire photocathode is illuminated by a delta
function light pulse.
The electron transit time is the interval between
the arrival of delta function light pulse at the
entrance window of the tube and the time when
the anode output reaches the peak amplitude. In
measurement, the whole photocathode is
illuminated.