


KODAK VISION Color Print Film / 2383, 3383 • H-1-2383t 5
CURVES
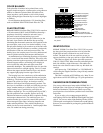
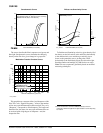
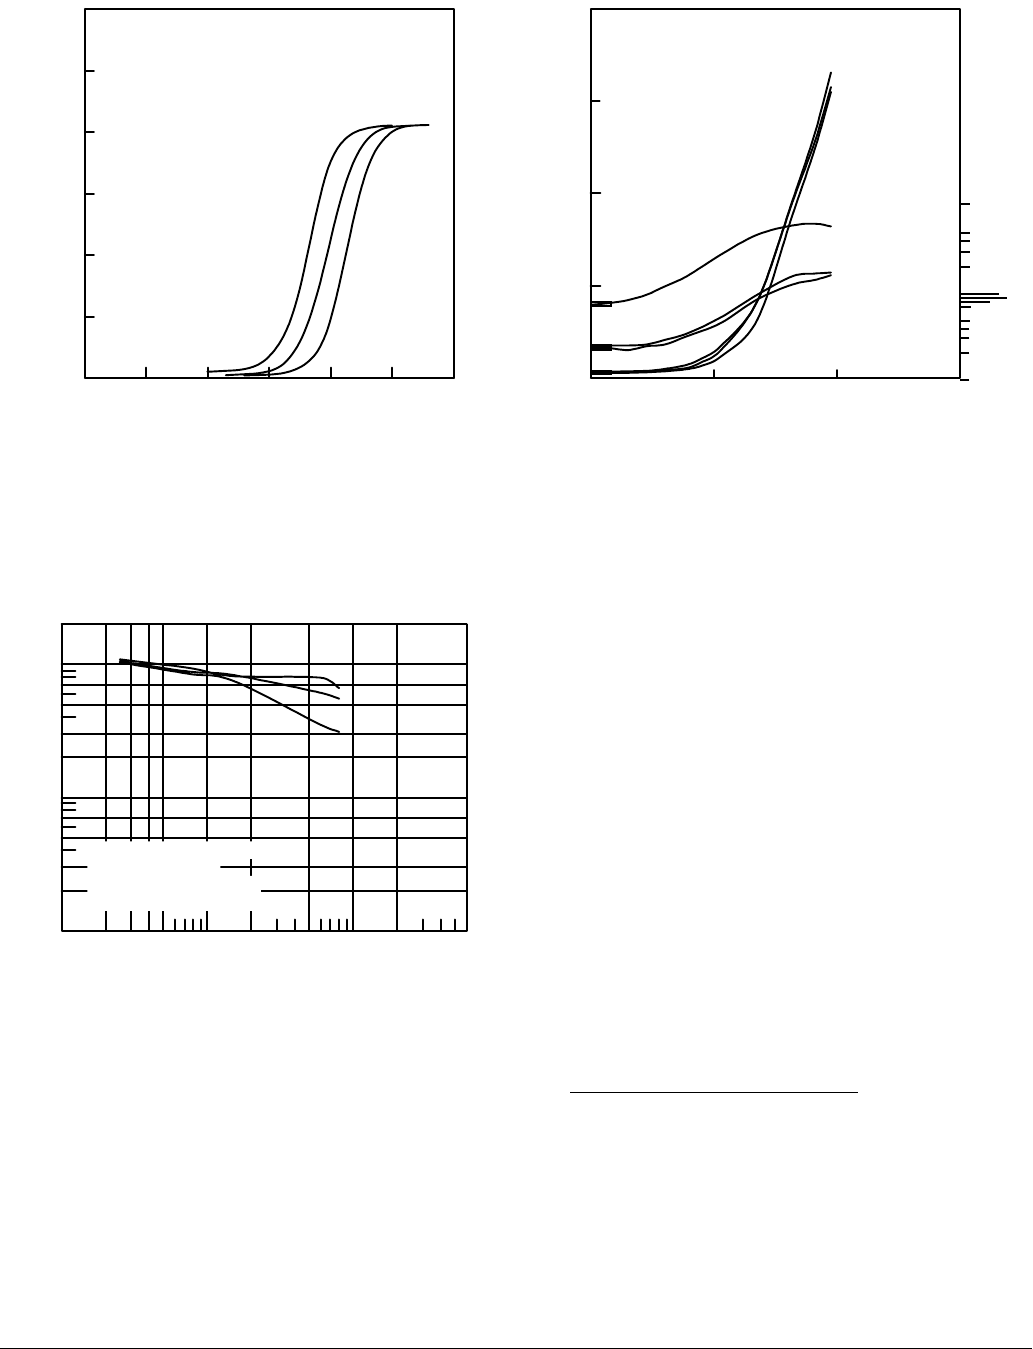
Sensitometric Curves
The curves describe this film's response to red, green, and
blue light. Sensitometric curves determine the change in
density on the film for a given change in log exposure.
3
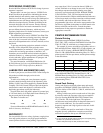
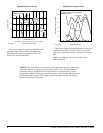
Modulation-Transfer Function Curves
This graph shows a measure of the visual sharpness of this
film. The x-axis, “Spatial Frequency,” refers to the number
of sine waves per millimeter that can be resolved. The y-axis,
“Response,” corresponds to film sharpness. The longer and
flatter the line, the more sine waves per millimeter that can
be resolved with a high degree of sharpness—and, the
sharper the film.
Exposure:1/500 sec Tungsten plus KODAK
Heat Absorbing Glass, No. 2043 (plus Series 1700 Filter);
Process: ECP-2D; Status A Densitometry
0.0
1.0
2.0
3.0
4.0
5.0
6.0
-3.0 -2.0 -1.0 0.0 1.0 2.0 3.0
LOG EXPOSURE (lux-seconds)
DENSITY
B
G
R
F002_1254AC
Exposure: Tungsten 3200 K
Process: ECP-2D
Densitometry: Status A
35% Modulation Target
1001 2 3 4 5 10 20 50 200 600
SPATIAL FREQUENCY (cycles/mm)
RESPONSE (%)
10
1
2
5
3
7
30
20
100
70
50
200
R
G
B
F010_0292AC
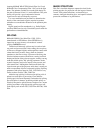
Diffuse rms Granularity Curves
To find the rms Granularity value for a given density, find
the density on the left vertical scale and follow horizontally
to the characteristic curve and then go vertically (up or
down) to the granularity curve. At that point, follow
horizontally to the Granularity Sigma D scale on the right.
Read the number and multiply by 1000 for the rms value.
Note: This curve represents granularity based on modified
measuring techniques.
3
3.NOTE: Sensitometric and Diffuse RMS Granularity curves are
produced on different equipment. A slight variation in curve shape may
be noticed.
F010_0295AC
Process:
ECP-2D
Densitometry:
Status A
0.0
1.0
2.0
3.0
R
G
B
R
G
B
4.0
0.0 1.0 2.0 3.0
.100
.050
.040
.030
.020
.010
.009
.008
.007
.005
.004
.003
.002
.001
LOG EXPOSURE (lux-seconds)
DENSITY