


Screen Display
45
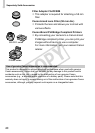
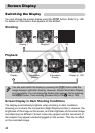
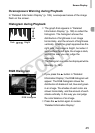
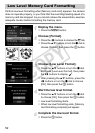
Overexposure Warning during Playback
In “Detailed Information Display” (p. 199), overexposed areas of the image
flash on the screen.
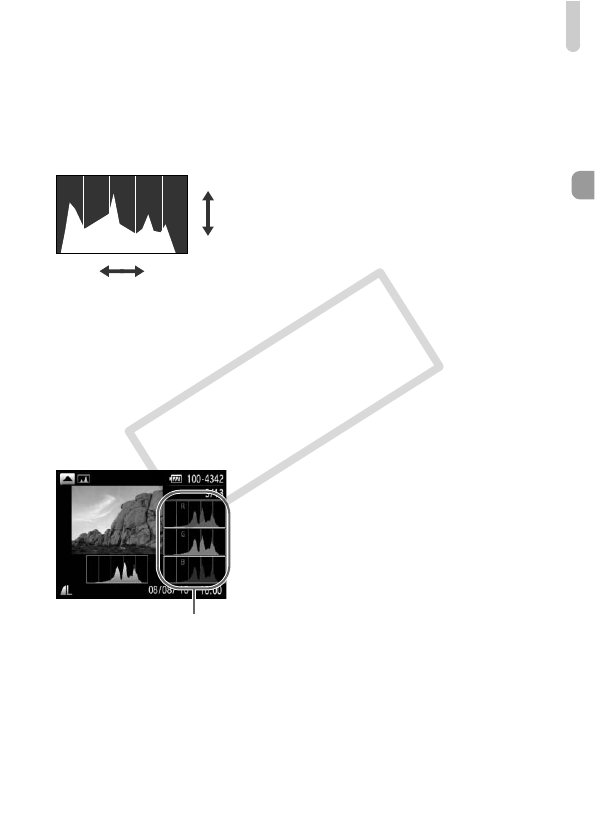
Histogram during Playback
● The graph that appears in “Detailed
Information Display” (p. 199) is called the
histogram. The histogram shows the
distribution of brightness in an image
horizontally, and the amount of brightness
vertically. When the graph approaches the
right side, the image is bright, but when it
approaches the left side, the image is dark,
and in this way you can judge the
exposure.
● The histogram can also be displayed while
shooting (p. 196).
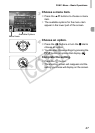
RGB Histogram
●
If you press the
o
button in “Detailed
Information Display”, the RGB histogram will
appear. The RGB histogram shows the
distribution of shades of red, blue and green
in an image. The shades of each color are
shown horizontally, and the amount of each
shade vertically. In this way you can judge
the color balance of an image.
●
Press the
o
button again to restore
“Detailed Information Display”.
Bright
Dark
High
Low
RGB Histogram
COPY