


KODAK VISION Premier Color Print Film / 2393
™
• H-1-2393t 5
SENSITOMETRIC CURVES
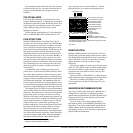
The curves describe this film’s response to red, green, and
blue light. Sensitometric curves determine the change in
density on the film for a given change in log exposure.
Sensitometric Curves
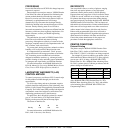
SPECTRAL-SENSITIVITY CURVES
These curves depict the sensitivity of this film to the
spectrum of light. They are useful for adjusting optical
printers and film recorders and for determining,
modifying, and optimizing exposure.
Spectral-Sensitivity Curves
The spectral sensitivity of VISION Premier Color Print
Film /2393 more closely matchesEASTMAN EXR Color
Intermediate Film 5244, 2244. This gives a better match
between direct prints and prints from a duplicate negative
produced on EASTMAN EXR Color Intermediate Film.
Heat Absorbing Glass, No. 2043
5.0
F010_0057AC
LOG EXPOSURE (lux-seconds)
1.0
0.0
0.0
DENSITY
1.0
2.0
3.0
6.0
1.0
2.0
Densitometry:
Exposure:
Process:
ECP-2B
1/500 sec Tungsten plus KODAK
Status A
B
G
R
3.0
4.0
(plus Series 1700 Filter)
700 750650600550500450400350300250
*Sensitivity = reciprocal of exposure (ergs/cm ) required
to produce specified density
WAVELENGTH (nm)
2
LOG SENSITIVITY
3.0
*
2.0
1.0
0.0
1.0
1.0
Tungsten exp. 1/50 sec
Process:
Effective Exposure:
Density:
ECP-2B
Yellow-
Forming
Layer
Magenta-
Forming
Layer
Cyan-
Forming
Layer
F010_0059AC
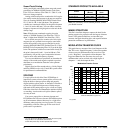
DIFFUSE RMS GRANULARITY CURVES
The emulsion granularity of this film is similar to Film
2386 / E / 3386 / E. VISION Premier Color Print
Film / 2393 does have a higher level of very small matte.
The matte particles may be visible at extremely close
viewing distance to the screen, especially in clear (D-min)
areas of the print.
To find the rms granularity value for a given density,
find the density on the left vertical scale and follow
horizontally to the sensitometric curve and then go
vertically (up or down) to the granularity curve. At that
point, follow horizontally to the Granularity Sigma D
scale on the right. Read the number and multiply by 1000
for the rms value.
Diffuse RMS Granularity Curves
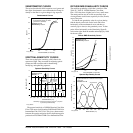
Spectral-Dye-Density Curves
.007
.008
.001
.002
.003
.004
.005
.009
.010
.020
.030
.040
.050
.100
R
G
B
GRANULARITY SIGMA D
3.8
3.6
3.4
3.2
3.0
2.4
2.6
2.2
1.8
2.0
1.6
0.2
0.4
0.6
0.8
1.0
1.2
R
G
B
Status A
ECP-2B
Process:
Densitometry:
3.02.0
4.0
2.8
1.4
DENSITY
0.0
0.0 1.0
LOG EXPOSURE (lux-seconds)
F010_0061AC
650600550500450
1.2
1.0
Cyan
Yellow
400
0.0
350
WAVELENGTH (nm)
700
DIFFUSE SPECTRAL DENSITY
0.4
0.2
0.8
0.6
1.4
750
Typical densities for a midscale neutral subject
and D-min.
ECP-2B
Process:
Visual Neutral
Magenta
F010_0060AC