


4 KODAK VISION3 500T Color Negative Film 5219 / 7219 / SO-219 • H-1-5219t
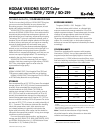
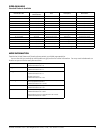
Modulation-Transfer Function Curves
This graph shows a measure of the visual sharpness of
this film. The x-axis, "Spatial Frequency," refers to the
number of sine waves per millimeter that can be resolved.
The y-axis, "Response," corresponds to film sharpness.
The longer and flatter the line, the more sine waves per
millimeter that can be resolved with a high degree of
sharpness—and, the sharper the film.
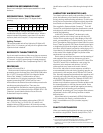
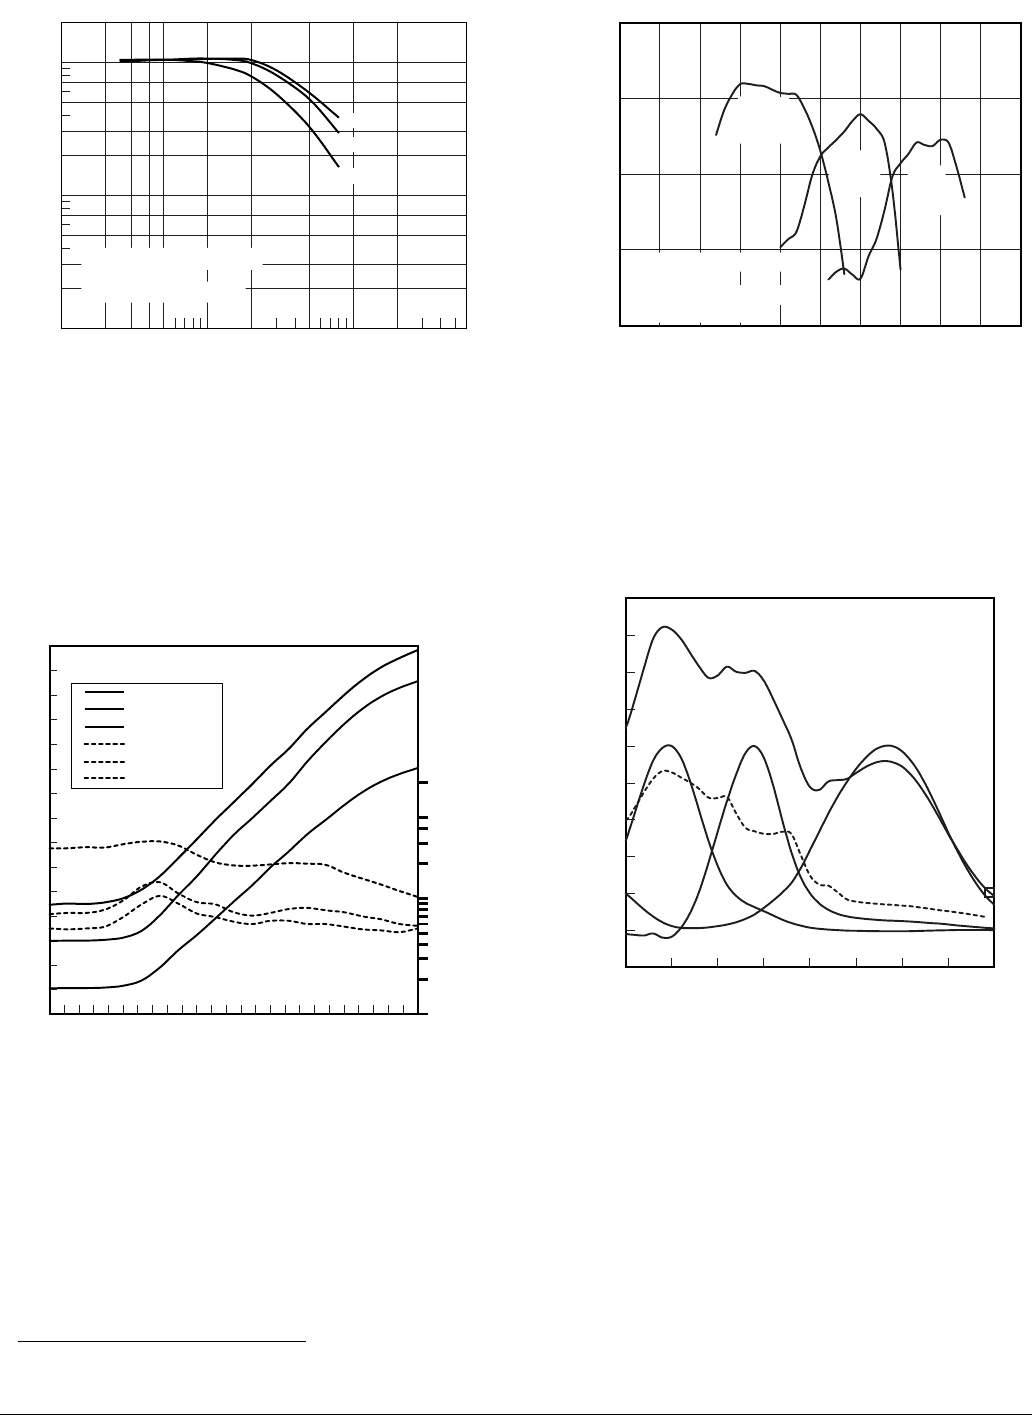
Diffuse rms Granularity Curves
To find the rms Granularity value for a given density, find
the density on the left vertical scale and follow horizontally
to the characteristic curve and then go vertically (up or
down) to the granularity curve. At that point, follow
horizontally to the Granularity Sigma D scale on the right.
Read the number and multiply by 1000 for the rms value.
Note: This curve represents granularity based on modified
measuring techniques.
4
4. Sensitometric and Diffuse RMS Granularity curves are produced on
different equipment. A slight variation in curve shape may be noticed.
Exposure: 3200K Tungsten
Process: ECN-2
Densitometry: Status M
1001 2 3 4 5 10 20 50 200 600
SPATIAL FREQUENCY (cycles/mm)
RESPONSE (%)
10
1
2
5
3
7
30
20
100
70
50
200
R
G
B
TI2647B
Process: ECN-2
0.02
0.03
0.04
0.05
0.10
0.005
0.004
0.003
0.002
0.01
0.006
Blue Density
Green Density
Red Density
Blue Grain
Green Grain
Red Grain
GRANULARITY SIGMA D
.001
R
G
R
G
B
B
4.0 5.02.0
0.0 1.0
3.0
2.0
1.0
DENSITY
0.0
LOG RELATIVE EXPOSURE
3.0
TI2647C
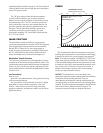
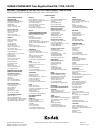
Spectral Sensitivity Curves
These curves depict the sensitivity of this film to the
spectrum of light. They are useful for determining,
modifying, and optimizing exposure for blue- and
green-screen special-effects work.
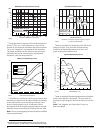
Spectral Dye Density Curves
These curves depict the spectral absorptions of the dyes
formed when the film is processed. They are useful for
adjusting or optimizing any device that scans or prints the
film.
Note: Cyan, Magenta, and Yellow Dye Curves are
peak-normalized.
Effective Exposure: 1/25 sec
Process: ECN-2
Densitometry: Status M
Densitry: 0.2>D-min
700 750650600550500450400350300250
*Sensitivity = reciprocal of exposure (erg/cm ) required
to produce specified density
WAVELENGTH (nm)
2
LOG SENSITIVITY
0.0
*
1.0
2.0
3.0
4.0
Yellow-
Forming
Layer
Magenta-
Forming
Layer
Cyan-
Forming
Layer
TI2647D
Process: ECN-2; D-mins subtracted
-0.2
0.2
0.0
0.4
0.6
0.8
1.0
1.2
1.4
1.6
1.8
400 450 500 550 600 650 700 750 800
Yellow
Magenta
Cyan
Minimum Density
Midscale Neutral
DIFFUSE SPECTRAL DENSITY
WAVELENGTH (nm)
TI2647E