


33
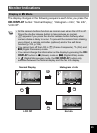
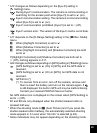
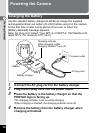
A guide for each available button operation appears as follows on the
display during operation.
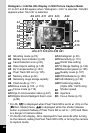
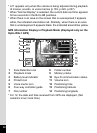
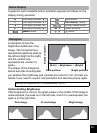
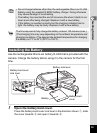
A histogram shows the
brightness distribution of an
image. The horizontal axis
represents brightness (dark at
the left and bright at the right)
and the vertical axis
represents the number of
pixels.
The shape of the histogram
before and after shooting tells
you whether the brightness and contrast are correct or not, and lets you
decide if you need to use EV compensation and take the picture again.
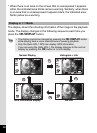
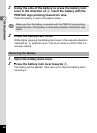
Understanding Brightness
If the brightness is correct, the graph peaks in the middle. If the image is
underexposed, the peak is on the left side, and if it is overexposed, the
peak is on the right side.
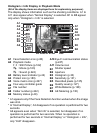
Guide Display
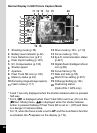
2 Four-way controller (2) Zoom button
3 Four-way controller (3) 4/W button
4 Four-way controller (4) Shutter release button
5 Four-way controller (5) X, i Green/i button
3 button I, JI button
Histogram
Setting the Exposure (EV Compensation) 1p.133
OK
SHUTTER
MENU
Number of pixels→
←Brightness→(Dark) (Bright)
Dark portions Bright portions
Dark image Correct image Bright image