


28
1
Getting Started
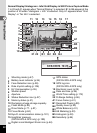
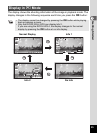
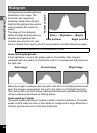
A histogram shows the brightness
distribution of an image. The
horizontal axis represents
brightness (dark at the left and
bright at the right) and the vertical
axis represents the number of
pixels.
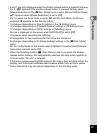
The shape of the histogram
before and after shooting tells you
whether the brightness and
contrast are correct or not, and
lets you decide if you need to use EV compensation and take the picture again.
Understanding Brightness
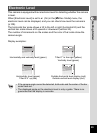
If the brightness is correct, the graph peaks in the middle. If the image is
underexposed, the peak is on the left side, and if it is overexposed, the peak is on
the right side.
When the image is underexposed, the part to the left is cut off (dark portions) and
when the image is overexposed, the part to the right is cut off (bright portions).
This camera has a function where overexposed areas are indicated as blinking
red and underexposed areas as blinking yellow.
Understanding Contrast
The graph peaks gradually for images in which contrast is balanced. The graph
peaks on both sides but sinks in the middle for images with a large difference in
contrast and low amounts of mid-level brightness.
Histogram
Setting the Exposure (EV Compensation) 1p.95
Number of pixels→
←Brightness→(Dark) (Bright)
Dark portions Bright portions
Dark image Correct image Bright image