


50
Taking Pictures
4
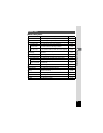
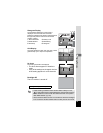
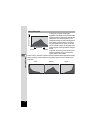
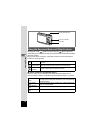
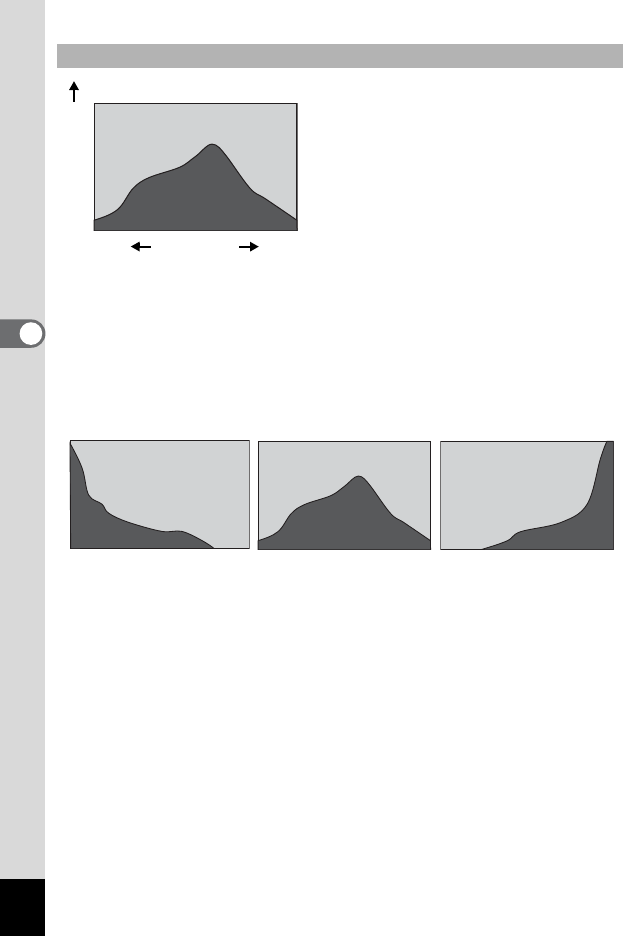
A histogram is a graph showing the
brightness of an image on the horizontal axis
and the number of pixels on the vertical axis
(distribution chart of the brightness). The
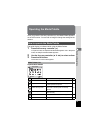
histogram will help you detect the brightness
of the image you have taken. For instance,
the graph peak tends to appear on the left
side for a darker image, and the graph peak
tends to appear on the right side for a brighter
image.
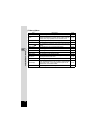
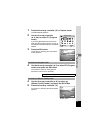
In general, when the exposure meter of your
image is well-balanced, the graph peaks
tend to appear in the middle.
On the contrary, when the exposure meter gets imbalanced tending dark and bright
without showing a neutral brightness, the peaks appear not in the middle but on
both sides.
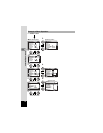
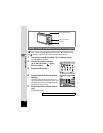
Using Histogram
Number of pixels
Brightness
(Dark) (Bright)
Dark Neutral Bright