


Chapter 4 Programming with NI-IMAQ for 1394 VIs
NI-IMAQ for IEEE-1394 Cameras User Manual 4-10 ni.com
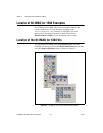
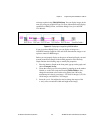
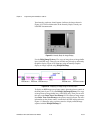
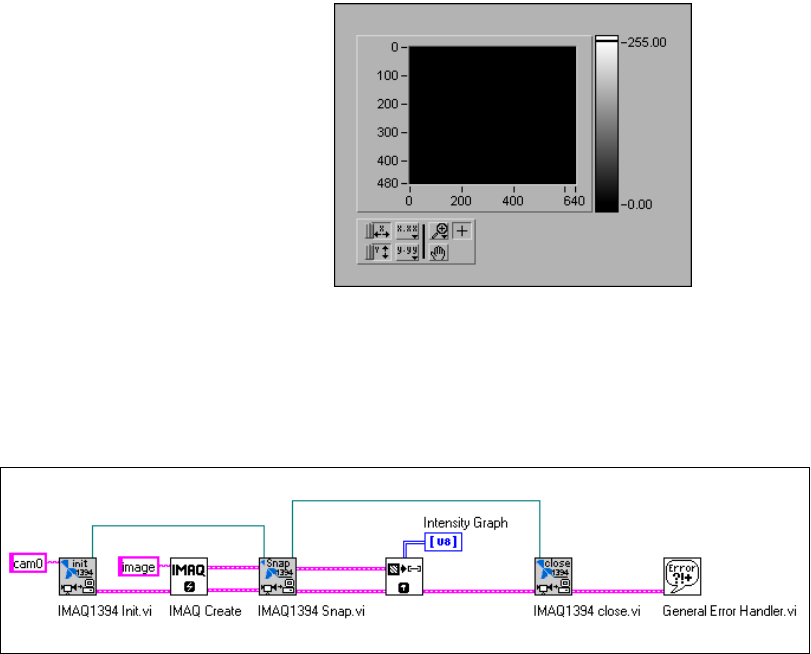
Your intensity graph now should appear similar to the image shown in
Figure 4-9. For more information on the Intensity Graph, consult your
LabVIEW documentation
Figure 4-9. Intensity Graph for Image Display
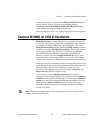
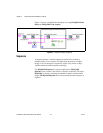
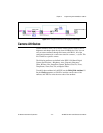
Use the IMAQ ImageToArray VI to copy an image from an image buffer
into a LabVIEW array. Then you can wire this array directly to an Intensity
Graph for display. Figure 4-10 illustrates using an Intensity Graph to
display an image acquired using IMAQ1394 Snap.
Figure 4-10. Displaying an Image Using an Intensity Graph
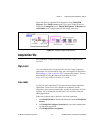
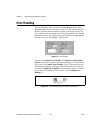
To display an RGB image on a picture control, place the picture control on
the frontpanel of yourVI. Use theIMAQ ColorImageToArray VIto copy
an image from an image buffer into a LabVIEW array. Then you can wire
thisarraytotheDraw True-Color Pixmap VI. Wire the new image output
from Draw True-Color Pixmap to the picture control indicator. For more
information on the picture control, consult the LabVIEW online reference.
Figure 4-11 illustrates using a picture control to display an RGB image
acquired with the IMAQ1394 Snap VI.