


Chapter 3 Making Grayscale and Color Measurements
© National Instruments Corporation 3-7 IMAQ Vision for Visual Basic User Manual
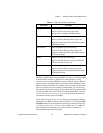
minimum intensity, and maximum intensity. Use
CWMachineVision.LightMeterRectangle to get the pixel
value statistics within a rectangular region in an image.
Use
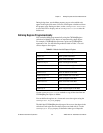
CWIMAQVision.Quantify to obtain the following statistics about the
entire image or individual regions in the image: mean intensity, standard
deviation, minimum intensity, maximum intensity, area, and the percentage
of the image that you analyzed. You can specify regions in the image with
a labeled image mask. A labeled image mask is a binary image that has
been processed so that each region in the image mask has a unique intensity
value. Use
CWIMAQVision.Label2 to label the image mask.
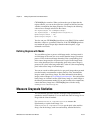
Use
CWIMAQVision.Centroid2 to compute the energy center of the
image, or of a region within an image.
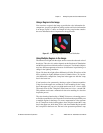
Measure Color Statistics
Most image processing and analysis methods apply to 8-bit and 16-bit
images. However, you can analyze and process individual components of a
color image.
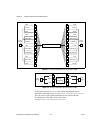
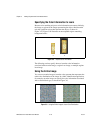
Using
CWIMAQVision.ExtractColorPlanes, you can break down
a color image into various sets of primary components, such as
RGB (Red, Green, and Blue), HSI (Hue, Saturation, and Intensity),
HSL (Hue, Saturation, and Luminance), or HSV (Hue, Saturation, and
Value). Each component becomes an 8-bit or 16-bit image that you can
process like any other grayscale image. Use
CWIMAQVision.ExtractSingleColorPlane to extract a single color
plane from an image. Use
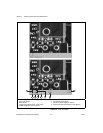
CWIMAQVision.ReplaceColorPlanes to
reassemble a color image from a set of three 8-bit or 16-bit images, where
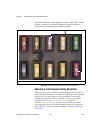
each image becomes one of the three primary components. Figures 3-3
and 3-4 illustrate how a color image breaks down into its three components.