


Addendum
Page 251
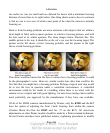
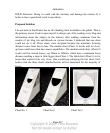
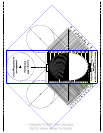
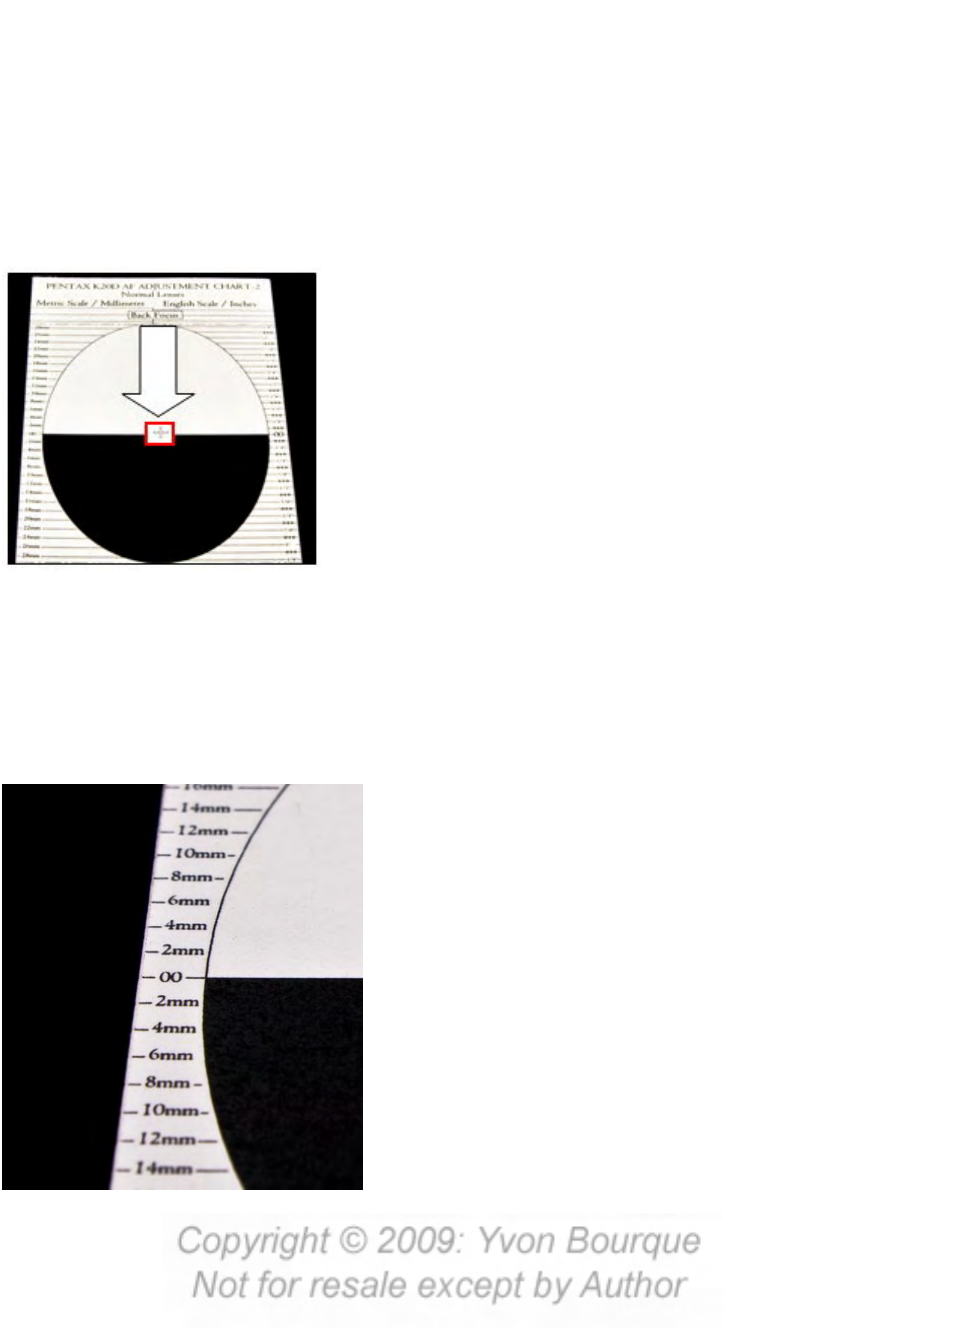
Next, move the camera / lens angle slowly downward until it auto focuses. At that
point, you know that you are focused on the intersection of the black / white portion
of the chart. That is the center of the chart. The measurements (Metric on the left
and English on the right) are at zero on both sides of the chart horizontal centerline.
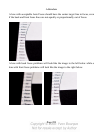
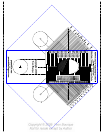
Take the picture and look at the results. The center target line (00) should be
perfectly clear while the top and bottom target lines and text should get increasingly
and proportionally out of focus. The top target lines represent the back focus area
while the bottom target lines represent the front focus
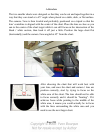
area. Repeat this test several times to make sure you
have done the test correctly. If the center target line is
in focus, but the front and back target lines are not
proportionally getting out of focus, there shouldn’t be
any serious problems with the lens. Remember that
this test is done with the lens opened at the maximum
aperture and that the depth of field will increase with
smaller aperture. Most of the lenses have a “sweet
spot which is usually 1 to 2 stop smaller than the maximum aperture. Therefore, you
should only be concerned if the center target line is not in perfect focus while either
the back or front lines are.
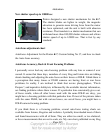
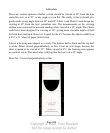
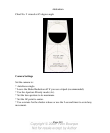
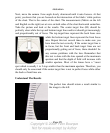
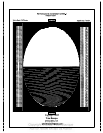
Understand The Results
The perfect lens should return a result similar to
the image to the left: