


77
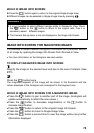
HISTOGRAM
The histogram is a graph depicting the distribution of brightness values in
the image for each of the three color channels (Red, Green, and Blue). The
horizontal axis shows the brightness level, with darker pixels towards the
left side and brighter pixels toward the right. The vertical axis shows the
proportion of pixels at each level of brightness.
By examining the histogram of the full image, you can gauge the overall
exposure of that image. You can also use the histogram to determine if
zoomed-in sections of an image are over or under exposed.
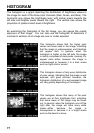
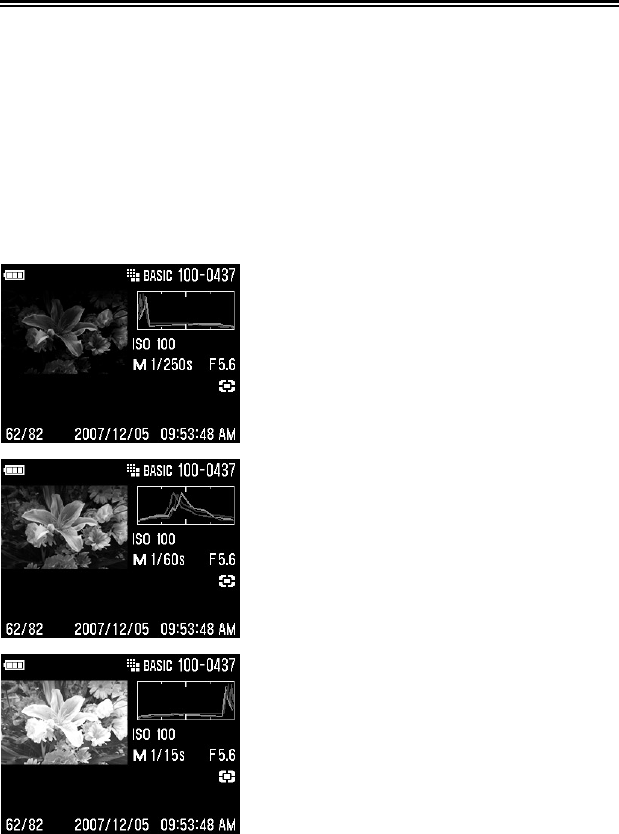
This histogram shows that the higher pixel
values are never used in the image, indicating
that the image is underexposed, and therefore
will appear dark. In general, when the
histogram is higher on the left side, the image
is mostly composed of dark pixels, causing it to
appear dark—either because the image is
underexposed or because it is a dark scene
such as night shot or sunset.
This histogram shows a fairly even distribution
of pixel values, indicating that the image is well
exposed, with good contrast. However, the
histogram distribution of a well exposed image
will vary greatly depending on the subject.
This histogram shows that many of the pixel
values are at their brightness limit, indicating
that some areas of the image may be blown
out. In general, when the histogram runs off the
right side, the image will have many white
pixels—either because the image is
overexposed or because it is a bright scene
such as the beach or snow.