


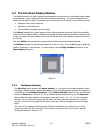
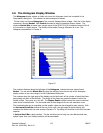

4.6 The Histogram Display Window
This Histogram display window is visible only when the Histogram check box is enabled in the
Computations dialog box. This window can be minimized and resized.
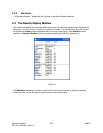
This bar chart is a fluence Histogram of the currently displayed frame of data. Each bar in the display
represents a fluence Bucket. Each Bucket describes a range of quantified fluence values. The
minimum Bucket Size is based upon a single count of the 8/10/12/14/15 bit digitized output of the A
to D converter or digital camera. The Bucket will be scaled if energy calibration is in use. See
Histogram computations in Chapter 6.
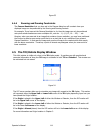
Figure 55
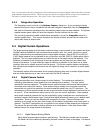
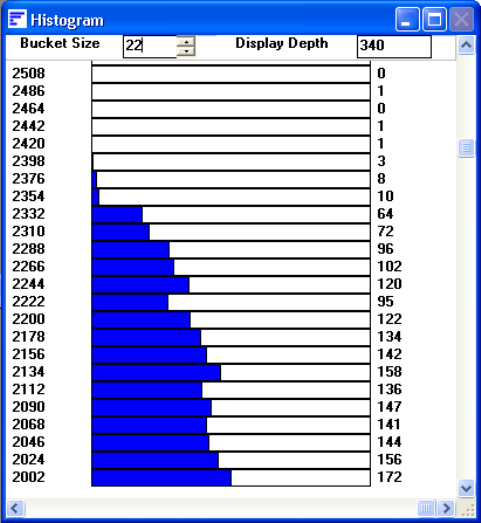
The numbers displayed along the left edge of the Histogram, indicate the lower value of each
Bucket. You can set the Bucket Size by using the edit/spin control at the top of the Histogram
display window or you can change it in the Computations dialog box.
The numbers along the right edge of the display are the total count of the number of pixels that have
been placed into each of the Buckets. The length of the drawn bar graphs the depth to which the
Bucket is filled. Zero count is on the left. The Display Depth indicator shows the current maximum
value of the horizontal scale. The horizontal scale is auto-ranged to the current maximum count.
The horizontal scale can be magnified, so that smaller values can be enlarged for easy viewing. With
the Horizontal Scroll Bar moved all the way to the right, the right edge of the bar display will
represent the Bucket with the most number of pixels in it. By sliding this scroll bar to the left, the scale
expands.
A Vertical Scroll Bar is also provided. This bar will allow you to bring into view Buckets that may
extend higher than your display resolution will accommodate.
Operator’s Manual LBA-PC
Doc. No. 10654-001, Rev 4.10
115