


GETTING READY
32
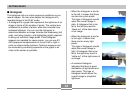
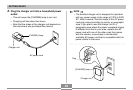
■ Histogram
The histogram lets you check exposure conditions as you
record images. You can also display the histogram of a
recorded image in the PLAY mode.
• A histogram is a graph that represents the lightness of an
image in terms of the number of pixels. The vertical axis
indicates the number of pixels, while the horizontal axis
indicates lightness. You can use the histogram to
determine whether an image includes the shadowing (left
side), mid tones (center), and highlighting (right) required
to bring out sufficient image detail. If the histogram
appears too lopsided for some reason, you can use EV
shift (exposure compensation) to move it left or right in
order to achieve better balance. Optimum exposure can
be achieved by correcting exposure so the graph is as
close to the center as possible.
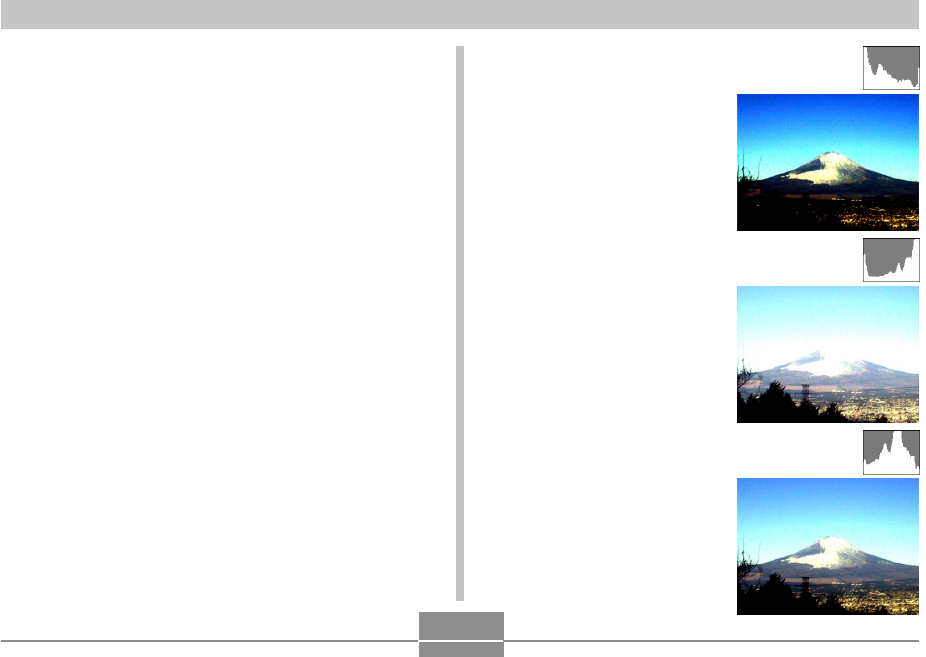
• When the histogram is too far
to the left, it means that there
are too many dark pixels.
This type of histogram results
when the overall image is
dark. A histogram that is too
far to the left may result in
“black out” of the dark areas
of an image.
• When the histogram is too far
to the right, it means that
there are too many light
pixels.
This type of histogram results
when the overall image is
light. A histogram that is too
far to the right may result in
“white out” of the light areas of
an image.
• A centered histogram
indicates that there is good
distribution of light pixels and
dark pixels. This type of
histogram results when the
overall image is at optimal
lightness.