


Screen Display
41
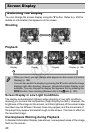
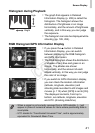
Histogram during Playback
z The graph that appears in Detailed
Information Display (p. 208) is called the
histogram. The histogram shows the
distribution of brightness in an image
horizontally, and the amount of brightness
vertically, and in this way you can judge
the exposure.
z The histogram can also be displayed while
shooting (pp. 185, 204).
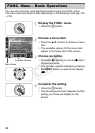
RGB Histogram/GPS Information Display
z If you press the o button in Detailed
Information Display, you can switch
between displaying the RGB histogram
and GPS information.
z The RGB histogram shows the distribution
of shades of red, blue and green in an
image. The shades are shown
horizontally, and the amount of each
shade vertically. In this way you can judge
the color of an image.
z If you switch to GPS information display,
you can check the location information
(latitude, longitude, elevation) and
shooting date recorded to still images and
movies (p. 112) when [GPS] is set to [On].
The displayed contents, from top to
bottom, are latitude, longitude, elevation
and UTC (shooting date/time).
Bright
Dark
High
Low
• When a signal is not correctly received from a GPS satellite, [---] will
appear in place of numerical values for items where positioning data is
incomplete.
• UTC stands for “Coordinated Universal Time”, and is approximately
equivalent to Greenwich Mean Time.
COPY