


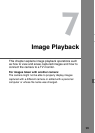
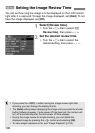
Image Playback
104
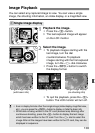
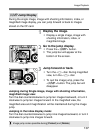
Histogram
A histogram is a graph indicating the image’s
brightness. The horizontal axis indicates the brightness
level (darker on the left and brighter on the right), while
the vertical axis indicates how many pixels exist for
each brightness level.
The more pixels there are toward the left, the darker
the image. And the more pixels there are toward the
right, the brighter the image.
If there are too many pixels on the left, the shadow
detail will be lost. And if there are too many pixels on
the right, the highlight detail will be lost. The tones in-
between will be reproduced.
By checking the image’s brightness histogram, you can
see the exposure level bias and the overall tone reproduction condition.
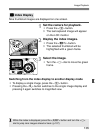
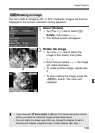
Highlight Alert
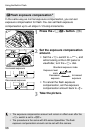
When the shooting information is displayed, any overexposed areas of
the image will blink. To obtain more image detail in the overexposed
areas, set the exposure compensation to a negative amount and shoot
again.
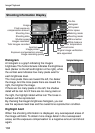
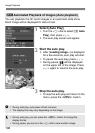
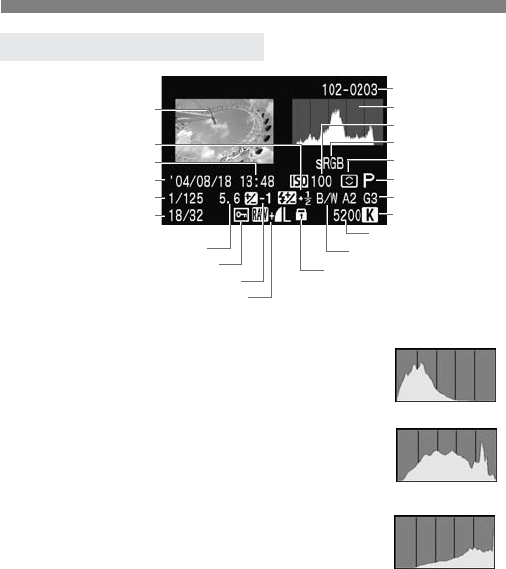
Shooting Information Display
File No.
Histogram
Color space
Shooting mode
Metering mode
ISO speed
WB correction
White balance
Shooting time
Color temperature
Image
Flash exposure
compensation amount
Shooting date
Aperture
Image protect
Shutter speed
Images recorded/
Total images recorded
Image-recording quality
Exposure compensation amount
Original image verification
data appended
Monochrome
Sample Histograms
Dark image
Normal image
Bright image