


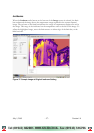
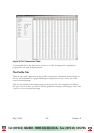

Figure 39. The Temperature Table
As mentioned above, this data can be saved as a .txt file, for import into a spreadsheet
program for your own in-depth analysis.
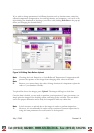
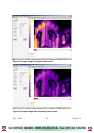
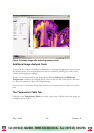
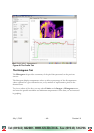
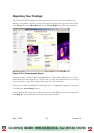
The Profile Tab
There are two main components in the profile: an interactive radiometric thermal image on
the top, and underneath it, a graph indicating the temperatures at the x and y axes of the
cursor on thermal image.
Click on any portion of the thermal image on the top for the exact temperature reading at
that spot. As you do this, you will see that the graph below changes, reflecting the new x and
y axes as you move around the image.
July 1, 2003 - 59 - Version 1.0
i
i
Tel: (01943) 602001- WWW.ISSLTD.CO.UK - Fax: (01943) 816796