


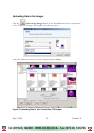
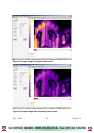
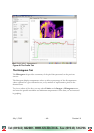
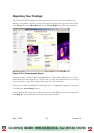
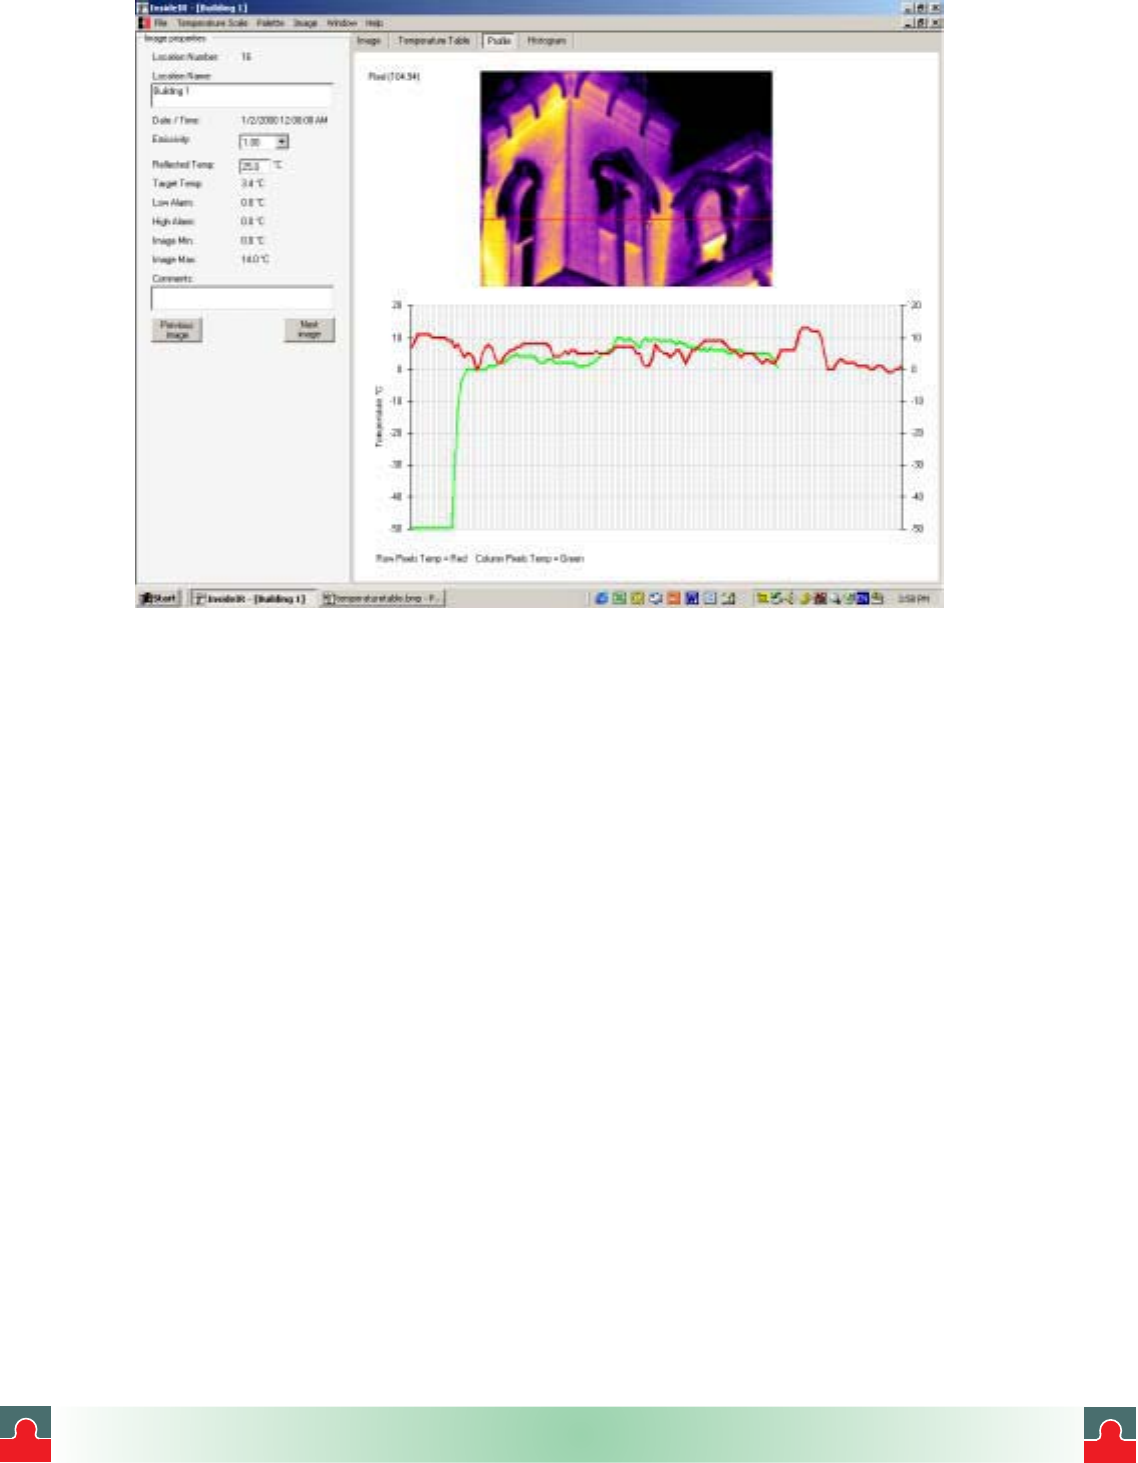
Figure 40. The Profile Tab
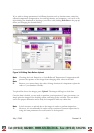
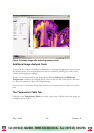
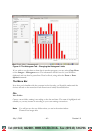
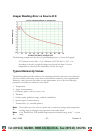
The Histogram Tab
The Histogram tab provides a summary of the pixel data presented on the previous
screens.
The histogram displays temperature values as either a percentage of the all temperature
values captured in a given thermal scene, or by number of representative pixels in the
thermal scene.
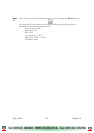
To view a subset of the data, you may select Limits on the Images > Histogram menu,
and enter the specific maximum and minimum temperatures for the data you are interested
in graphing.
July 1, 2003 - 60 - Version 1.0
i
i
Tel: (01943) 602001- WWW.ISSLTD.CO.UK - Fax: (01943) 816796