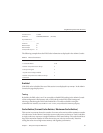
TABLE 2–7 JavaVirtual Machine(JVM) Statistics (Continued)
Total Number of ClassesUnloaded 0
Number of Garbage Collections Occurred 3
Number of Live Threads 8
Number of Started Threads 9
Peak Live Thread Count 8
Most of these statistics are not tunable. They provide information about the JVM's operation.
Another source of tuning information on the JVM is the package java.lang.management,
which provides the management interface for monitoring and management of the JVM. For
more information on this package, see
http://java.sun.com/
j2se/1.5.0/docs/api/java/lang/management/package-summary.html
.
Java Heap Tuning
As with all Java programs, the performance of the web applications in the Web Server is
dependent on the heap management performed by the JVM. There is a trade-o between pause
times and throughput. A good place to start is by reading the performance documentation for
the Java HotSpot virtual machine, which can be found at
http://java.sun.com/docs/hotspot/index.html.
Specic documents of interest include
“Tuning Garbage Collection with the 5.0 Java Virtual
Machine” (http://java.sun.com/docs/hotspot/gc5.0/gc_tuning_5.html)
and
“Ergonomics in the 5.0 Java Virtual Machine”
(http://java.sun.com/docs/hotspot/gc5.0/ergo5.html)
.
JVM options can be specied in the Admin Console on the conguration's Java tab ⇒ JVM
Settings sub tab. In the CLI, use the wadm commands set-jvm-prop and
set-jvm-profiler-prop.
Web Application Information
Web application statistics are displayed through the Admin Console, wadm get-config-stats
command), and stats-xml only. They are not shown in perfdump.
▼
To Access Web Application Statistics From the Admin Console
From the CommonTasks page, choose theMonitoring tab.
Click the conguration name to view webapplication statistics for the conguration.To view
web application statistics for the instance, click theInstance sub tab and theinstance name.
1
2
UsingMonitoringDatatoTuneYour Server
Chapter2 • TuningSunJavaSystemWebServer 71


