


48
48
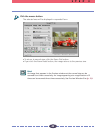
The data comprising an image contains a variety of brightness settings ranging from
shadows to highlights. These settings are represented in Plug-in module FS by values
ranging between 0 and 255. You can use the histogram to adjust the values assigned
to particular dot to either 0 or 255, to change the distribution of brightness settings
and to control the contrast.
The method is applicable to 8-bit grayscale, 12-bit grayscale, 24-bit color (when
ColorSync™ is off) and 36-bit color images.
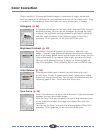
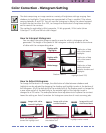
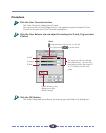
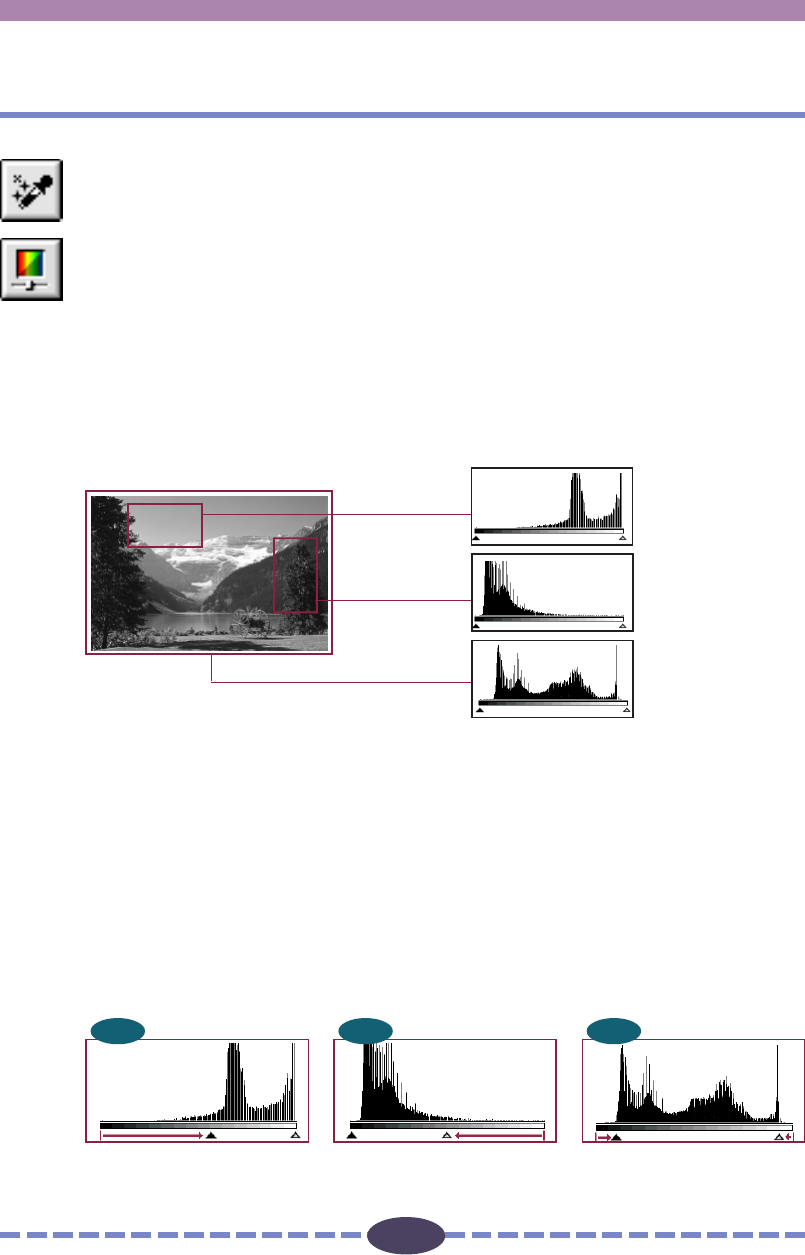
How to Interpret Histograms
You can select the entire image or specify an area for which a histogram will be
generated. The height of the peaks of the histogram is directly related to the volume
of data with the corresponding value.
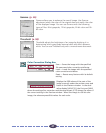
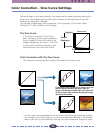
How to Adjust Histograms
To change the contrast in an image, the distribution of data between shadows and
highlights can be adjusted by dragging the shadow and highlight marks at the bottom of
the histogram. All of the data lying to the outside (left) of the shadow mark is changed to
a zero value and all of the data lying to the outside (right) of the highlight mark is
changed to a 255 value. The examples below show adjustments to improve the contrast.
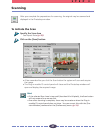
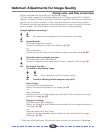
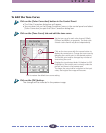
Leave the setting on Auto Correction for histogram correction of most scanning jobs.
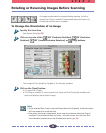
Color Correction - Histogram Setting
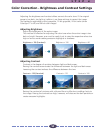
Move the highlight mark toward
the shadow end.
Move the shadow mark
toward the highlight end.
Move both the shadow and
highlight marks inward.
Image with a bias
toward highlights
Image with a bias
toward shadow
Image with well
distributed data
IMAGE
1
IMAGE
2
IMAGE
3
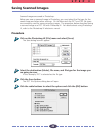
Portion with
Highlights
Portion with
Shadows
Entire Image
Distribution of data
with a bias toward
highlights.
Distribution of data
with a bias toward
shadows.
Distribution of data
widely distributed
between shadows and
highlights.
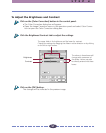
S T E P 4
Shadow (Level 0)
Highlight (Level 255)