


Continued on the following page >>
3.QA Mode Settings
– 19 –
6
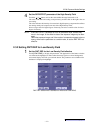
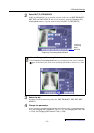
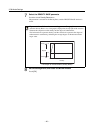
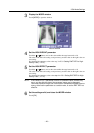
Display the DENSITY BASE window
Touch the DENSITY BASE button to open the window.
For details of the DENSITY BASE parameter, refer to the step 5 in 2.2 Setting DWT
ENHANCE. Tab (→ P.9).
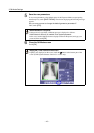
DENSITY BASE Window
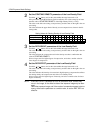
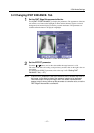
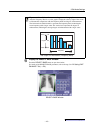
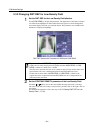
Representation of the enhancement degree on a bar graph
After the Frequency Base is set, a bar graph is displayed at the top-right of the screen
to illustrate the comparisons with the frequency bands and degree of enhancement.
The horizontal axis labeled with Lv represents the frequency band, indicating the
lower frequency with a larger value. The vertical axis represents the degree of
enhancement, indicating the stronger degree of enhancement with a larger value.
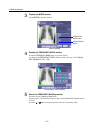
Bar Graph of Enhancement (Frequency Base)
1.0
0.5
0.0
Lv1
Lv2 Lv3 Lv4 Lv5
Strong
Weak
Degree
Frequency
High Low