


3.QA Mode Settings
– 20 –
7
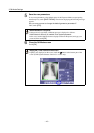
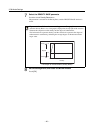
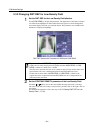
Select the DENSITY BASE parameter
Touch the desired Density Base button.
The parameter is selected for the Density Base, and the DENSITY BASE window is
closed.
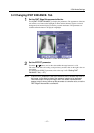
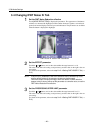
8
Set the settings valid, and close the MORE window
Touch [OK].
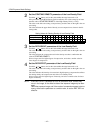
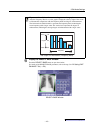
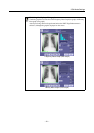
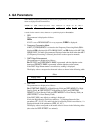
Representation of the enhancement degree on a line graph
After the Density Base is set, a line graph is displayed at the top-right of the screen to
illustrate the comparisons with density and the degree of enhancement.
The horizontal axis represents density, and the vertical axis represents the degree of
enhancement in each density, indicating the stronger degree of enhancement with a
larger value.
Line Graph of Enhancement (Density Base)
1.0
0.0
-0.5
0.2
Density
0.8 3.2
Strong
Weak
Degree