


84
4
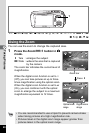
Taking Pictures
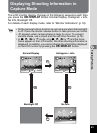
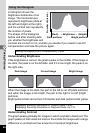
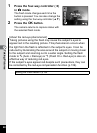
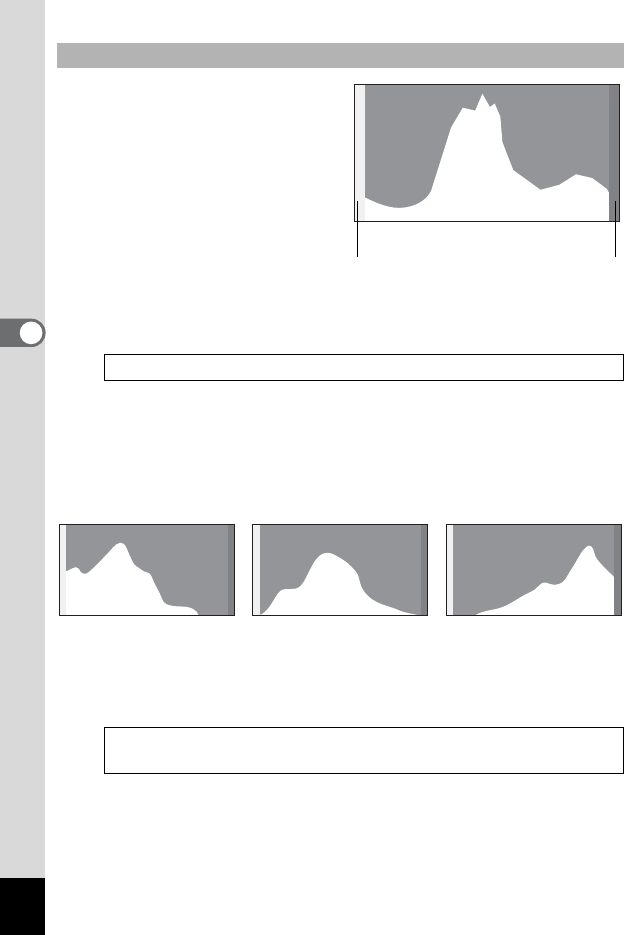
A histogram shows the
brightness distribution of an
image. The horizontal axis
represents brightness (dark at
the left and bright at the right)
and the vertical axis represents
the number of pixels.
The shape of the histogram
before and after shooting tells
you whether the brightness and
contrast are correct or not, and lets you decide if you need to use EV
compensation and take the picture again.
Understanding Brightness
If the brightness is correct, the graph peaks in the middle. If the image is
too dark, the peak is on the left side, and if it is too bright, the peak is on
the right side.
When the image is too dark, the part to the left is cut off (dark portions)
and when the image is too bright, the part to the right is cut off (bright
portions).
Bright portions blink red on the LCD monitor and dark portions blink yellow.
Understanding Contrast
The graph peaks gradually for images in which contrast is balanced. The
graph peaks on both sides but sinks in the middle for images with a large
difference in contrast and low amounts of mid-level brightness.
Using the Histogram
Setting the Exposure (EV Compensation) 1p.82
Displaying Shooting Information in Capture Mode 1p.83
Displaying Shooting Information in Playback Mode 1p.119
Dark portions Bright portions
Number of pixels→
←Brightness→(Dark) (Bright)
Dark image Correct image Bright image