


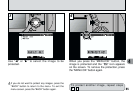

◆
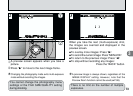
Histograms
◆
A histogram is a chart showing the distribution of brightness in an image
(horizontal axis: brightness; vertical axis: pixels).
➀
Optimal exposure: There is an ample distribution of pixels overall with a peak
in the middle range.
➁
Overexposed : The number of highlight pixels is high with the distribution
sloping upwards to the right.
➂
Underexposed : The number of shadow pixels is high with the distribution
sloping upwards to the left.
●
!
The shape of the graph will vary depending on the subject.
78
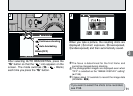
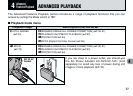
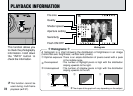
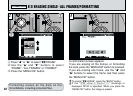
PLAYBACK INFORMATION
This function allows you
to check the photography
information. Hold down
the “INFO” button to
check the information.
●
!
This function cannot be
used during multi-frame
playback (
➡P.37).
File size
Quality
Shutter speed
Aperture setting
Sensitivity
Flash ON/OFF
Histogram
Shadows Highlights
Brightness
Pixels
123