


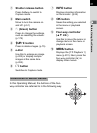
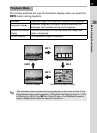
Before Using Your Camera
1
29
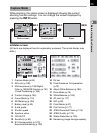
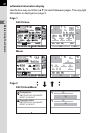
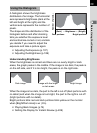
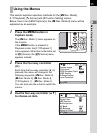
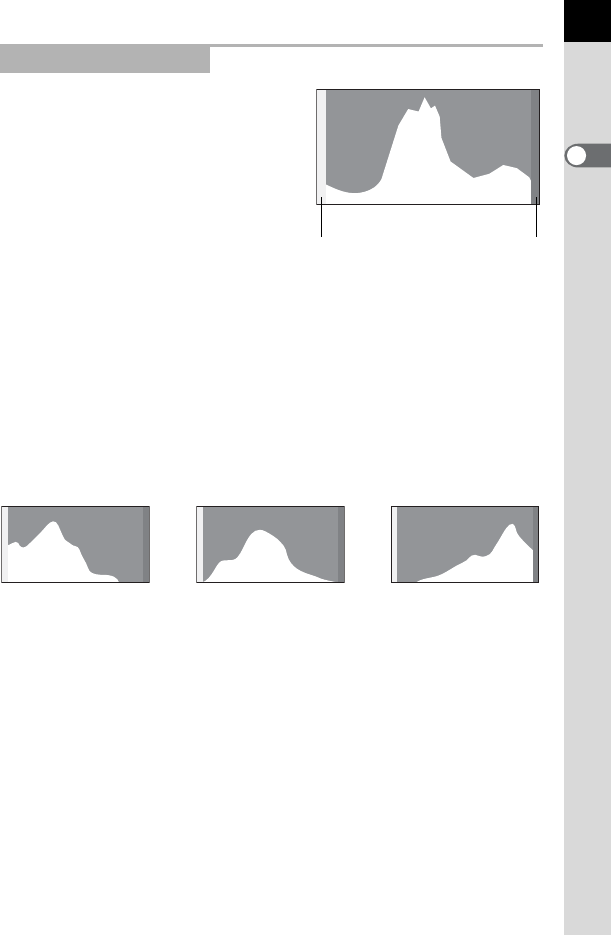
A histogram shows the brightness
distribution of an image. The horizontal
axis represents brightness (dark at the
left and bright at the right) and the
vertical axis represents the number of
pixels.
The shape and the distribution of the
histogram before and after shooting
tells you whether the exposure level
and contrast are correct or not, and lets
you decide if you need to adjust the
exposure and take a picture again.
1 Adjusting the Exposure (p.107)
1 Adjusting the Brightness (p.189)
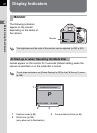
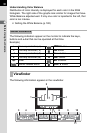
Understanding Brightness
When the brightness is correct and there are no overly bright or dark
areas, the graph peaks in the middle. If the image is too dark, the peak is
on the left side, and if it is too bright, the peak is on the right side.
When the image is too dark, the part to the left is cut off (dark portions with
no detail) and when the image is too bright, the part to the right is cut off
(bright portions with no detail).
Bright portions blink red and dark portions blink yellow on the monitor
when [Bright/Dark Area] is O (On).
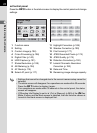
1 Playing Back Images (p.74)
1 Setting the Display for Instant Review (p.249)
Using the Histogram
Number of pixels→
←Brightness→(Dark) (Bright)
Dark portions Bright portions
Dark image Image with few bright
or dark areas
Bright image