


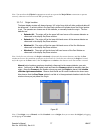
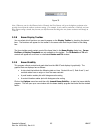
Figure 33
Note: Whenever you do a Soft Zoom while in 3D mode, the Wire Density will go to the highest resolution value
possible, based upon the camera resolution setting. For example, if your camera resolution is 256x240, and your
Wire Frame setting is 64x60, the first time you Soft Zoom into the image the wire frame resolution will change to
128x120.
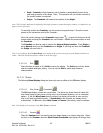
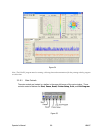
3.2.8 Beam Display Toolbar
You can select which functions you want to appear on the Display Toolbar by checking the desired
item. The functions will appear on the toolbar in the same order that they are listed in this dialog
box.
The three toolbar.panels contain most of the items listed in the Beam Display dialog box. Cursor
Profiles and Display Thresholds are not available on the toolbar. The 3D Rotate and Tilt edit
controls will appear as scroll bars in a dedicated Rotate and Tilt window.
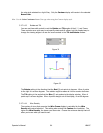
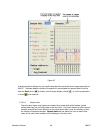
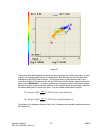
3.2.9 Beam Stability
This program collects centroid and peak data from the LBA-PC and displays it graphically. The
graphics that are displayed are as follows:
• A strip chart that collects the following data vs. time. Centroid X and Y, Peak X and Y, and
centroid radius from an origin or from the mean centroid.
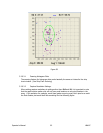
• A peak location scatter plot with histogram color-coding
• A centroid location scatter plot with histogram color-coding
Click on the Options menu item and then click Launch Beam Stability… to start the beam stability
program. This will open up a new window with the beam stability program that looks like the window
below:
Operator’s Manual LBA-PC
Doc. No. 10654-001, Rev 4.10
85