


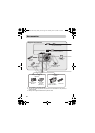
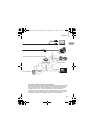

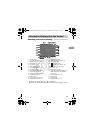
Information Displayed on the Screen
44
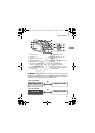
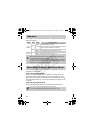
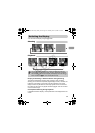
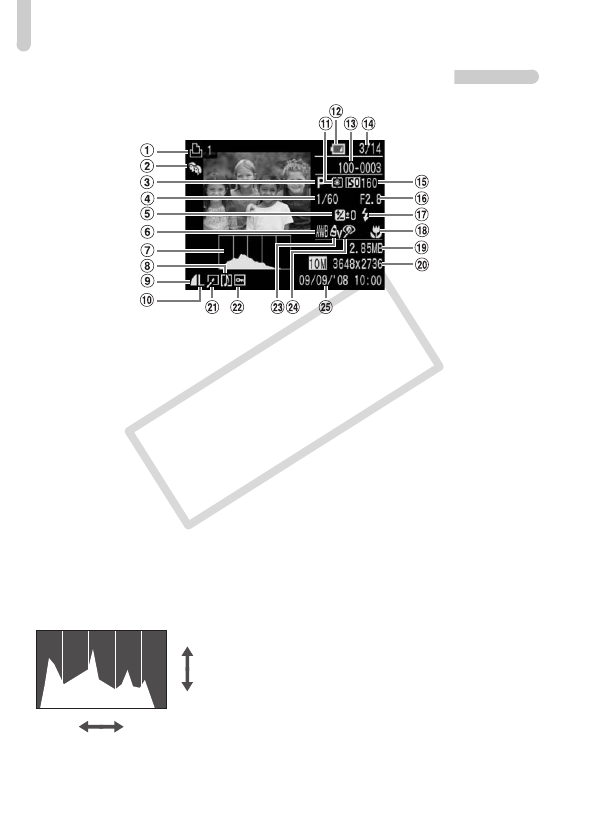
Playback (Detailed Information Display)
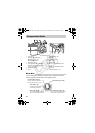
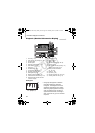
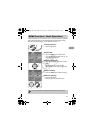
Histogram
● The graph that appears in Detailed
Information Display is called the
histogram. The histogram shows the
distribution of brightness of an image.
When the graph approaches the right
side, the image is bright, but when it
approaches the left side, the image is
dark, and in this way you can check the
exposure.
a Print List (p. 111)
b Auto Category/My Category (p. 96)
c Shooting Mode
d Shutter Speed
e Exposure Compensation (p. 74)
f White Balance (p. 73)
g Histogram
h Sound Memo (p. 107)
i Compression Ratio (p. 70)
j Recording Pixels (p. 70)
k Metering Mode (p. 85)
l Battery Charge Indicator (p. 16)
m Folder Number-File Number (p. 119)
n Displayed image number and total
number of images
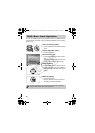
o ISO Speed (p. 72)
p Aperture Value
q Flash (p. 59)
r Macro/Infinity Mode (pp. 64, 65)
s File Size (p. 71)
t Still Images: Recording Pixels (p. 71)
Movies: Movie Length (p. 91)
u
Red-Eye Correction /Resize
(
p
p. 102, 105)
v Protect (p. 102)
w My Colors (p. 75)
x Red-Eye Correction (pp. 105, 122)
y Shooting Date and Time (p. 18)
Dark Bright
High
Low
(EC248) CDI-E386_Guide_E.book Page 44 Thursday, June 19, 2008 4:52 PM
COPY