Monitor Your Network
50
NMS300 Network Management System Application
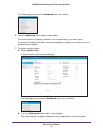
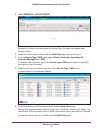
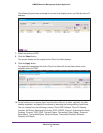
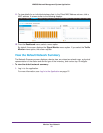
3. To view details about a device, click the device name.
For more information, see View Device Information and Device Details on page 40.
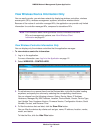
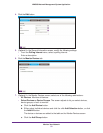
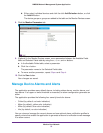
Manage the Configuration Monitors
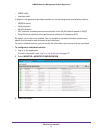
The application provides monitors for the following device metrics:
• Status
• ICMP ping
• CPU
• Memory
• T
emperature
• IP traffic
• ICMP traffic
• TCP traffic
• UDP traffic
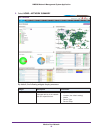
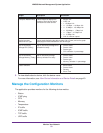
Enterprise Network Map A world map that displays the
location of each device and its
connections to other devices
• Manual link
• LLDP link
• < 1.5 Mbps link
• >= 1.5 Mbps < 10 Mbps link
• >= 10 Mbps < 100 Mbps link
• >= 100 Mbps < 1 Gbps link
• >= 1 Gbps < 10 Gbps link
• >= 10 Gbps link
• Link of unknown speed
Device Inventory
Status/Device T
ype
A slice graph displaying the device status (Up or Down) and a slice graph
displaying the network breakdown per device type.
T
op 10 Devices by
Average CPU (T
oday)
Top 10 devices by average CPU
utilization for today
• Device status
• Device name
• Device type
• CPU utilization in percentage
Top 10 Devices by
A
verage Memory (T
oday)
Top 10 devices by average
memory utilization for today
• Device status
• Device name
• Device type
• Memory utilization in percentage
Latest 10 Alarms • Alarm Name
• Device Name
• Severity
• Alarm Time
Widget Description Information


