


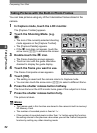
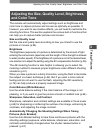

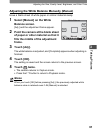
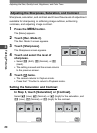

Adjusting the Size, Quality Level, Brightness, and Color Tone
60
3
Taking Pictures
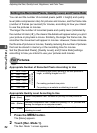
Using the Histogram
This camera has a function for displaying a graph (histogram) that shows
the tonal range of your scene with the darkest areas on the left and the
brightest ones to the right. The height of the points along the graph show
the number of pixels at each brightness value.
The shape of the histogram, which can be viewed before and after
shooting, shows the brightness and contrast of the picture so you can
decide if you want to use EV compensation to improve it.
1 “Displaying Shooting Information in Capture Mode” (p.41), “Displaying
Shooting Information” (p.88)
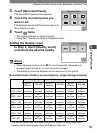
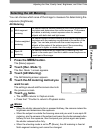
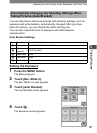
Understanding Brightness
Usually, if the exposure is correct, the graph peaks in the middle. If the
image is too dark, the peak is on the left side, and if it is too bright, the
peak is on the right side.
When the image is too dark, the part to the left is cut off (dark portions)
and when the image is too bright, the part to the right is cut off (bright
portions).
With EV compensation, you can adjust the exposure so that the
distribution is contained within the graph without the graph peaking on the
left or right side, thereby preventing pictures that are too dark or too light.
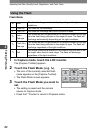
Understanding Contrast
The graph peaks gradually for images in which
contrast is balanced. The graph peaks on both
sides but sinks in the middle for images with a
large difference in contrast and low amounts of
mid-level brightness.
Dark image Correct image Bright image