49
Enhancing Images
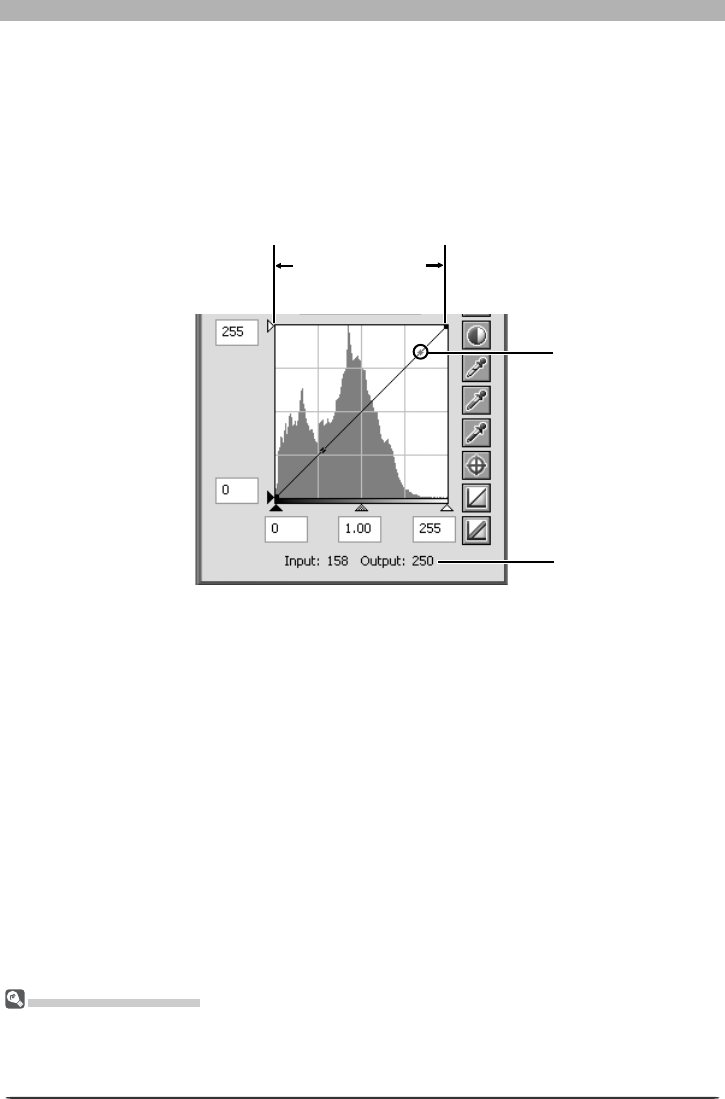
When the cursor is moved over an image or over the curve edit display, the input and output
values for the point under the cursor are shown in the input/output display. The input value
represents the level of the pixel in the original image, the output value the level of the pixel
after any changes to the curve have been applied.
The Curve Edit Display
Although values for input and output in the Curves palette range from zero to 255 (eight-bit pre ci sion,
familiar to users of other image editing software), the results of any changes to curves are calculated at
a precision of sixteen bits. This allows twelve-bit RAW data to be modifi ed without lowering the quality
of the output.
Input is plotted along the horizontal axis, with shadows (the dark areas of the image) to the
left, high lights (the bright areas of the image) to the right, and mid-tones in between. The
left end of the axis marks the minimum possible value for colors in the selected channel (zero,
or no color), the right end the maximum value. In the case of the master curve, the minimum
value represents areas of the input image that are a true black; the maximum value represents
areas that are a true white. Output is plotted along the vertical axis, with the minimum pos-
sible output value (again, zero, or no color) at the bottom and the maximum output value at
the top.
Input/output display
High lights
Shadows
Brightness of point
under cursor


