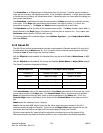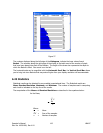
Notice: In general it is not advisable to use the Auto Aperture feature when making Top Hat measurements.
6.18.1 Top Hat Mean and Standard Deviation
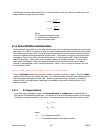
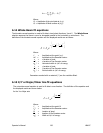
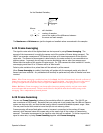
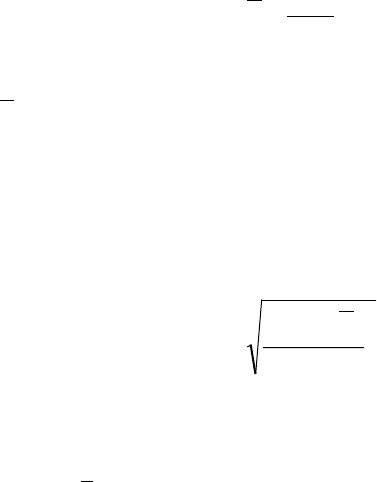
The computation of the Mean and Standard Deviation are described in the equations below:
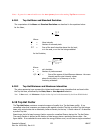
for the Mean,
Z
Z
n
=
∑
Where:
Z
= Mean intensity
n
= Number of summed pixels
Σ
Z
= Sum of the pixel intensities above the clip level,
or in the area, or on the line being evaluated.
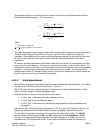
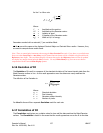
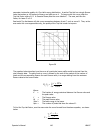
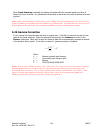
for the Deviation,
()
σ
=
−
−
∑
ZZ
n 1
2
Where:
σ
= std. deviation.
n
= Number of pixels summed.
Σ
(
Z
-
Z
)² = Sum of the square of the differences between the mean
intensity and the pixel intensity values
above the clip level, or in the area, or on the
line being evaluated.
6.18.2 Top Hat Minimum and Maximum intensities
The values appearing here represent the highest and lowest energy intensities that are found within
the Top Hat area, as defined by the Data, Area or Line Aperture selection.
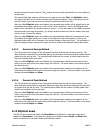
Note: In Data mode, the Minimum will often be the clip level value determined by the Beam Width Method.
6.19 Top Hat Factor
The Top Hat Factor provides a numerical measure of quality for a Top Hat beam profile. It is a
normalized value that compares your beam profile against a perfect Top Hat--a perfect Top Hat being a
beam with vertical sides and an absolutely uniform intensity on the top. A Factor value of 1.0 describes
a perfect Top Hat.
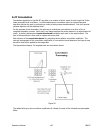
Examining a plot of a beam’s energy fraction versus its normalized fluence derives the Top Hat Factor.
The energy fraction is defined as the fraction of total energy above a particular fluence value. See
figure below. If we calculate the area under the energy fraction curve, we will have a single normalized
Operator’s Manual LBA-PC
Doc. No. 10654-001, Rev 4.10
139


