


Instruction Manual
748467-A
January 2002
Rosemount Analytical Inc. A Division of Emerson Process Management Operation 3-21
Model MicroCEM
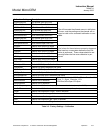
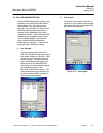
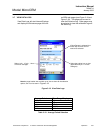
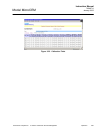
3-7 VIEW DATA LOGS
View Data Logs will start Internet Explorer
and display the Emissions page of the Mi-
croCEM web pages (see Figure 3-18 and
Figure 3-19). This page can be used to
view the Emissions log. Other pages may
be selected to view the calibration log and
the alarm log.
Figure 3-18. View Data Logs
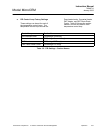
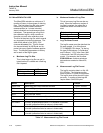
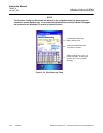
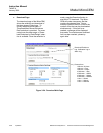
Average Period Time Range Displayed
1 Minute 1 Hour
15 Minutes 1 Day
1 Hour 3 Days
12 Hours 1 Month
24 Hours 3 Months
Table 3-10. Average Period Selection
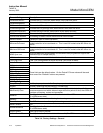
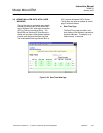
Select 1 min., 15 min., 1 hour
or 24 hour averages.
Select the ending hour to view
(applicable only to 1- minute
averages)
If Most Recent is selected, the
month day and hour do not
need to be selected.
Note the page header was scrolled out of view to show all the selection
options, but it can be seen in
Figure 3-19.