


52
MODEL 54e pH/ORP SECTION 6.0
THEORY OF OPERATION
6.9 PID CONTROL (continued)
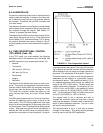
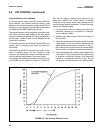
Process Reaction Curve Method
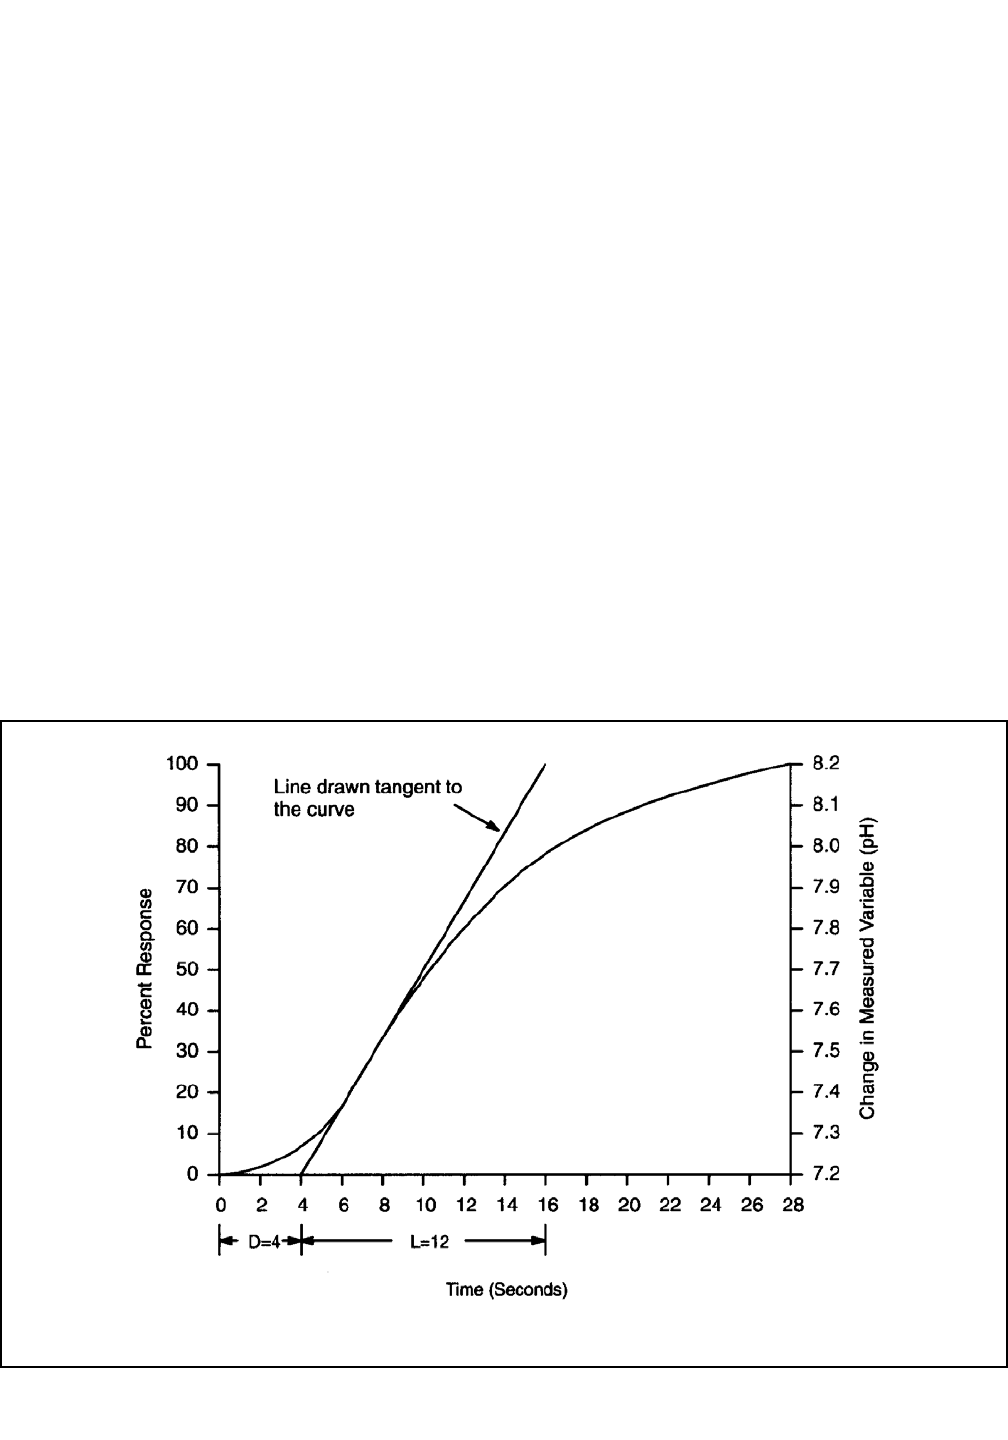
A PID loop can be tuned using the Process Reaction
Curve Method. This method involves making a step
change in the chemical feedrate (usually about 50% of
the pump or valve range) and graphing the response of
the Model 54e pH/ORP reading versus time.
The process reaction curve graphically shows the reac-
tion of the process to step change in the input signal.
Figure 6-2 shows an example of a tuning process for a
pH controller. Similar results can be obtained for the
conductivity controller.
To use this procedure with a Model 54e pH/ORP and a
control valve or metering pump, follow the steps out-
lined below.
The Model 54e pH/ORP should be wired to the control
valve or metering pump. You will introduce a step
change to the process by using the simulate test func-
tion to make the step change in the output signal.
The change in the measured variable (conductivity, pH,
or millivolts) will be graphed as shown in Figure 6-2.
This can be done by observing the reading on the
Model 54e pH/ORP and noting values at intervals
timed with a stop watch. A strip chart recorder can be
used for slower reacting processes. To collect the data,
perform the following steps:
1. Let the system come to a steady state where the
measured variable (pH, conductivity or tempera-
ture) is relatively stable.
2. Observe the output current on the main display of
the controller.
3. Using the simulate test, manually set the controller
output signal at the value which represented the
stable process measurement observed in step 1,
then observe the process reading to ensure steady
state conditions (a stable process measurement).
4. Using the simulate test, cause a step change in the
output signal. This change should be large enough
to produce a significant change in the measured
variable in a reasonable amount of time, but not
too large to drive the process out of desired limits.
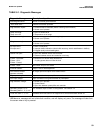
FIGURE 6-2. The Process Reaction Curve