


33
Exposure Evaluation
Digital Spot Metering
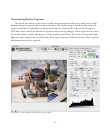
e camera control software includes two types of digital spot meters. e first is a “live” spot
meter that displays information about the image as the cursor is moved within the preview area.
Specific areas of the image can be metered at any time by moving the cursor to the area of interest in
the preview image and reading the various displays. e second type of digital spot meter is a “static”
spot meter which allows for up to twelve locations in the image to be recorded and recalled. ese
readings are updated automatically when a new prescan is performed, allowing rapid rechecking of
important areas to see the effects of adjustments.
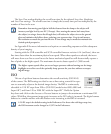
e live spot meter is available whenever the cursor is within the preview image area,
regardless of the currently selected tool. e Spot Meter
tool may be selected from the
tool buttons at the top of the preview screen to mark static spot meter locations in the pre
-
view image.
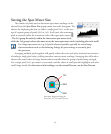
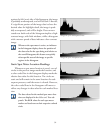
RGB Data Values, EV Units
When the cursor is within the preview image area the information for the pixels under the cursor
is displayed above the histogram. e information is continually updated as the cursor is moved to
various locations within the image.
Above the histogram window, the individual red, green, and blue output data values are dis
-
played, with a range of zero (minimum brightness, or maximum print density) to 255 (maximum
brightness, or minimum print density). e average of the red, green, and blue values is displayed as
the RGB value.
In addition to the RGB values, the relative EV display provides additional information about the
pixels under the live spot meter cursor. e EV display is on the right side and is always preceded by
a “+” or “-” and these numbers show the relative EV (f-stops) for the metered location. is reading is
affected by exposure and color balance changes, but not significantly by tone curve changes.
Zero on this EV scale is preset to about 4.5 EV (4.5 f-stops) below the maximum CCD
exposure, providing a readout range of as much as +4.5 to -5.2 EV (over 9 f-stops). If the
zero point on the sliding scale under the Tone curve is moved, the live spot meter EV
values will change to correspond to the new zero point.
Use the EV readout to determine the relative differences in luminance between various parts of
the scene. is can be helpful in selecting or adjusting the tone curve and/or the lighting to achieve a
predetermined range of image data.