


37
Histogram
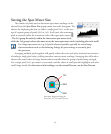
In addition to the location-specific image information provided
by the spot meter, a histogram display presents overall image expo
-
sure information at a glance for the currently selected crop area. is
display has a horizontal scale from zero to 255, representing the pos
-
sible 8-bit data values for the image data (either any single color or
an average of R, G, and B for “gray” data). e vertical scale repre
-
sents the relative population of each data value by means of a black
vertical line whose height varies from zero to full scale according to
the frequency of occurrence of that data value in the preview image.
By evaluating the shape and location of the histogram data (black areas), the overall range and domi
-
nant areas of image data can be quickly determined.
To provide the maximum amount of useful exposure information, the histogram display is usu
-
ally set to clip very high readings for dominant data values, to allow lower readings to be seen more
prominently. is mode will often produce a flat-topped peak in the dominant data area, but clearly
shows the remaining distribution of data, which is often more important than the relative heights of
the distribution. is histogram clipping can be turned off by “normalizing” the data display. When
normalized, the most frequently-occurring data value is set to exactly the full vertical scale, and all
remaining data values are adjusted accordingly. is mode more accurately represents the distribution
within dominant peaks, but may make large portions of the less populous data range too small to dis
-
play. To switch normalization on or off, select Normalize Histogram from the Display menu, or use
the Command-N keyboard
(Control-N in Windows) shortcut. A checkmark beside the Normalize
Histogram submenu item indicates that normalization is on (no data clipping).
Clicking the mouse in the histogram display will scale the histogram vertically by a factor
of two for each click. is feature can be used to see small peaks that would otherwise go
unnoticed. Holding the Option key and clicking in the histogram will reset the display to
the original scale.
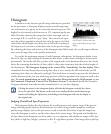
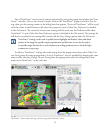
Judging Overall and Spot Exposures
e histogram display directly indicates the overall exposure and contrast range of the preview
image, allowing proper exposure determinations even when using portable computers with lower
quality image displays. Just as the spot meter is used to read the data values of specific image loca
-
tions, the histogram is used to read the data values of the entire image. e spread and distribution
of data values in the histogram can show under- or over-exposure, and whether an image will be low-
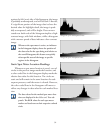
key (dark) or high-key (bright), contrasty or flat. If a significant portion of the image data is piled up
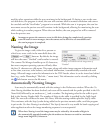
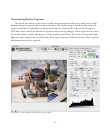
Histogram display of a Macbeth
ColorChecker® with six static spot
meters and the dynamic spot meter
display.