


63
As the focus is adjusted on a view camera, the
image also changes size, and therefore moves slightly
as a function of its distance from the optical axis.
e human eye-brain follows this movement during
focus adjustments, but the digital camera’s CCD
remains stationary, sometimes causing confusing
focus indications as edges or bright specular high
-
lights move in and out of the sensor’s view as focus is
changed.
Both of these problems may be mitigated by using the Magnification slider in the Focus tab
panel to change the system’s effective magnification and viewing area. Increase the magnification
and the sampling area will decrease; decreasing the magnification has the opposite effect. A higher
magnification allows finer details to be resolved better, and also shrinks the size of the viewing rect
-
angle to align better with small objects in the set. A lower magnification covers a longer section of the
image, providing more data in low-contrast situations.
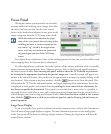
Reading the Focus Displays and Adjusting Focus
After the CCD is moved to the desired focusing location, readout and display of the selected
channel’s image data begins. e number of pixels output and displayed is fixed at 100; the various
available magnifications utilize different resolution settings to achieve different spans of coverage. e
largest sampling area, 4X magnification, uses one of the lowest resolution settings, which combines
many CCD pixels into each output pixel. e highest magnification and smallest sampling area, 32X,
uses one of the highest resolution settings, so few CCD pixels are combined into each output pixel.
e CCD is not moving during the focus operation, instead, the same portion of the selected channel
is read out and displayed as often as possible, usually faster than ten updates per second.
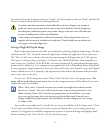
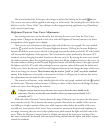
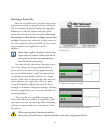
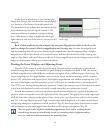
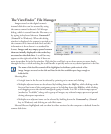
As each line segment is read out, the selected pixels are first displayed as a graph of brightness vs.
position in the rectangular box on the right side of the Focus panel. is graph shows each output pix
-
el’s 8-bit data value (relating to the selected Tone Curve) as its vertical position, with 0 at the bottom
and 255 at the top. Best focus across high-contrast edges will be displayed as the most vertical (most
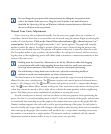
abrupt) step changes in brightness (vertical position) (Fig. A); best focus across low-contrast textures
will be displayed as the most jagged (most detailed) small changes in brightness (Fig. B).
is line graph can be helpful in establishing approximate focus, and in verifying that the
desired image features are indeed being viewed (by correlating relative brightness and tex
-
ture, etc.), and have adequate variations for measuring focus.
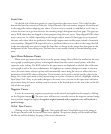
C. Focus display for a poorly chosen focus location without
distinct edges.