


126
ADVANCED SETTINGS
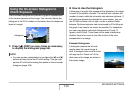
The on-screen histogram that provides a graphic representation
of the current exposure of the image. You can also display the
histogram in the PLAY mode for information about the exposure
levels of images.
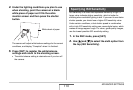
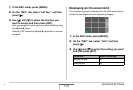
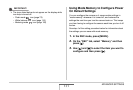
1. Press [S] (DISP) as many times as necessary
to display the histogram (page 56).
NOT
E
• You can use key customization to configure the [W] and [X]
buttons so they control the EV shift setting. Then you can
perform EV shift while viewing the results on the on-screen
histogram (page 128).
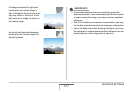
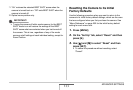
■ How to Use the Histogram
A histogram is a graph that represents the lightness of an image
in terms of the number of pixels. The vertical axis indicates the
number of pixels, while the horizontal axis indicates lightness. If
the histogram appears too lopsided for some reason, you can
use EV shift to move it left or right in order to achieve better
balance. Optimum exposure can be achieved by EV shifting so
the graph is as close to the center as possible. For snapshots,
you can even display individual histograms for R (red), G
(green), and B (blue). These lines can be used to determine
whether there is too much or too little of each of the color
components in an image.
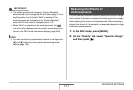
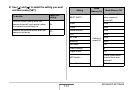
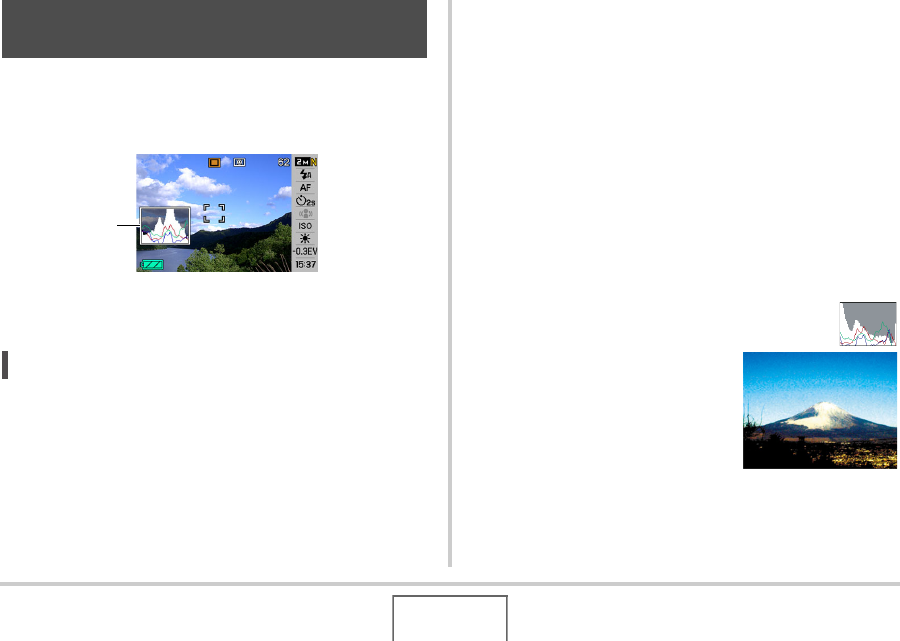
Example Histograms
A histogram towards the left side
results when the overall image is
dark. A histogram that is too far to the
left may result in “black out” of the
dark areas of an image, as shown in
the nearby image.
Using the On-screen Histogram to
Check Exposure
Histogram