


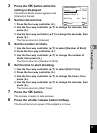

74
4
Taking Pictures
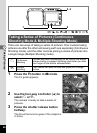
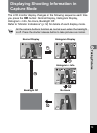
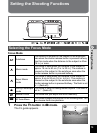
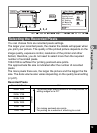
A histogram is a graph showing the brightness of the image on the
horizontal axis (darkest at the left and brightest at the right) and the
number of pixels on the vertical axis.
The shape of the histogram tells you whether the exposure of the image
is correct or not. If the exposure is correct, the graph peaks in the middle.
If the image is too dark, the peak is on the left side, and if it is too bright,
the peak is on the right side.
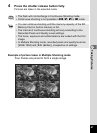
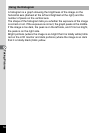
Bright portions (where the image is so bright that it is totally white) blink
red on the LCD monitor and dark portions (where the image is so dark
that it is totally black) blink yellow.
Using the Histogram