


9-5
User Guide for Cisco Show and Share 5.3.x
Chapter 9 Use Show and Share Author Reports
Procedures
Procedures
• Generate Reports, page 9-5
• Export Report Data, page 9-5
Generate Reports
Before You Begin
This software uses scalable vector graphics in its charting. For browser requirements, see Release Notes
for Cisco Digital Media Suite 5.2.x on Cisco.com.
Procedure
Step 1 Log-in to Cisco Show and Share.
Step 2 Choose My Account, open the Videos drawer, and then and then click the Reports tab.
Step 3 Choose the desired report from the Report by list.
Step 4 Select a date range for the report to cover by doing one of the following:
• Choose a pre-defined range from the Date range list.
• Enter a specific range using the Start date and End date fields. You can type a date directly in the
field in MM/DD/YYYY format or you can click the calendar button to scroll to the desired date.
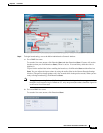
Step 5 (Optional) Select a specific video to run the report on:
a. Click to expand the Select video drawer.
A list of your videos appears.
b. If needed, use the Search by Title field to search for a specific title or the sort list to help navigate
to the video.
c. Click the video title to select the video.
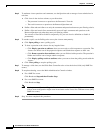
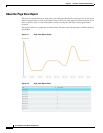
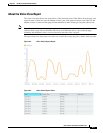
Step 6 Click the Create report button.
A graph and a table of data for your report appears at the bottom of the page.
Export Report Data
You can export your report data to an Excel spreadsheet.
Procedure
Step 1 Run your report as described in Generate Reports, page 9-5.
Step 2 Click the Export to Excel button below the report data table.
Step 3 Depending upon your browser, you may be prompted to open or save the file. Follow the instructions in
your browser’s dialog box.