Specifications
5–6
1780R-Series Operator’s Manual
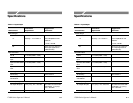
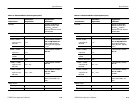
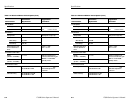
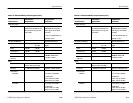
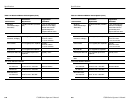
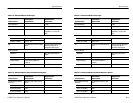
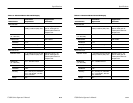
Table 5–2: Waveform Monitor Vertical System (Cont.)
Characteristics
Supplemental
Information
Performance
Requirements
Diff Steps
(Differentiated Steps
Attenuation)
>40 dB at 3.58 MHz (4.43 MHz
PAL)
5 step, 20 IRE staircase
within 2% of flat display.
Vertical Gain increase
approximately 5X to
compare staircase risers.
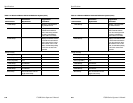
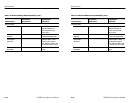
Linear Waveform Distortion
Pulse Preshoot,
Overshoot, & Ringing
≤1% of applied pulse amplitude. Typically:
<0.5% on T Pulse.
<1.0% on T/2 Pulse.
Pulse and Bar ≤1% of applied pulse amplitude. Typically:
<0.5% on T Pulse.
<1.0% on T/2 Pulse.
25 ms Bar Tilt
≤1% of applied bar amplitude.
Field Square Wave Tilt ≤1% of applied square wave
amplitude.
Typically <0.5%.
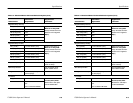
2T Sin
2
Pulse-to-Bar
Ratio
1:1 ±1%.
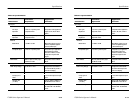
Non-Linear Waveform Distortion
Differential Gain
Aux Video Out ≤0.25% at 10% – 90% APL. Waveform Modes.
Pix Mon Out ≤0.25% at 10% – 90% APL.
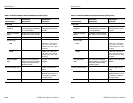
Differential Phase
Aux Video Out
≤0.25_ at 10% – 90% APL.
Pix Mon Out
≤0.25_ at 10% – 90% APL.


