


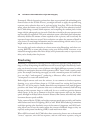
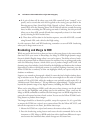

up with a finished image that has the extended dynamic range you’re looking for. (This
concludes the image editing portion of the chapter. We now return you to our alternate
sponsor: photography.)
Fixing Exposures with Histograms
While you can often recover poorly exposed photos in your image editor, your best bet
is to arrive at the correct exposure in the camera, minimizing the tweaks that you have
to make in post-processing. However, you can’t always judge exposure just by viewing
the image on your D7000’s LCD after the shot is made. Nor can you get a 100 percent
accurately exposed picture by using the D7000’s Live View feature. Ambient light may
make the LCD difficult to see, and the brightness level you’ve set can affect the appear-
ance of the playback image.
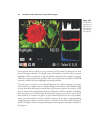
Instead, you can use a histogram, which is a chart displayed on the D7000’s LCD that
shows the number of tones being captured at each brightness level. You can use the infor-
mation to provide correction for the next shot you take. The D7000 offers four his-
togram variations in three screens: three histograms that show overall brightness levels
for an image and an alternate version that separates the red, green, and blue channels
of your image into separate histograms.
David Busch’s Nikon D7000 Guide to Digital SLR Photography128
DISPLAYING HISTOGRAMS
To view all the available histograms on your screen, you must have the D7000 set up
properly. First, you’ll need to mark Histograms using the Display Mode entry in the
Playback menu, as described in Chapter 8. That will make the Histograms screen visible
when you cycle among the informational screens while pressing the multi selector
up/down buttons while an image is displayed.
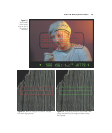
The most basic histogram is displayed during playback when you press the multi selec-
tor up/down buttons to produce the Overview Data screen, as described briefly in
Chapter 3, and shown in Figure 3.24. This screen provides a small histogram at the right
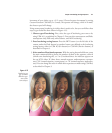
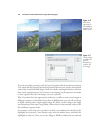
side that displays the distribution of luminance or brightness. The most useful histogram
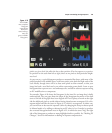
screen is the one shown in Figure 4.19, which displays both a luminance chart and sep-
arate red, green, and blue charts.
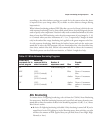
Both luminance and RGB histograms are charts that include a representation of up to
256 vertical lines on a horizontal axis that show the number of pixels in the image at
each brightness level, from 0 (black) on the left side to 255 (white) on the right. (The
three-inch LCD doesn’t have enough pixels to show each and every one of the 256 lines,
but, instead provides a representation of the shape of the curve formed.) The more