


pixels at a given level, the taller the bar at that position. If no bar appears at a particu-
lar position on the scale from left to right, there are no pixels at that particular bright-
ness level.
As you can see, a typical histogram produces a mountain-like shape, with most of the
pixels bunched in the middle tones, with fewer pixels at the dark and light ends of the
scale. Ideally, though, there will be at least some pixels at either extreme, so that your
image has both a true black and a true white representing some details. Learn to spot
histograms that represent over- and underexposure, and add or subtract exposure using
an EV modification to compensate.
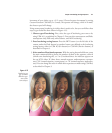
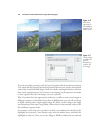
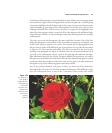
For example, Figure 4.20 shows the histogram (in the inset) for an image that is badly
underexposed. You can guess from the shape of the histogram that many of the dark
tones to the left of the graph have been clipped off. There’s plenty of room on the right
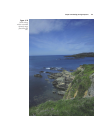
side for additional pixels to reside without having them become overexposed. Or, a his-
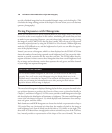
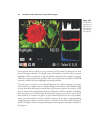
togram might look like the insert in Figure 4.21, which is overexposed. In either case,
you can increase or decrease the exposure (either by changing the f/stop or shutter speed
in Manual mode or by adding or subtracting an EV value in A or S modes) to produce
the corrected histogram shown inset in Figure 4.22, in which the tones “hug” the right
side of the histogram to produce as many highlight details as possible. See “Making EV
Changes,” above for information on dialing in exposure compensation.
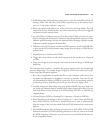
Chapter 4 ■ Getting the Right Exposure 129
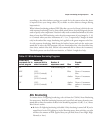
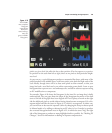
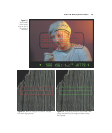
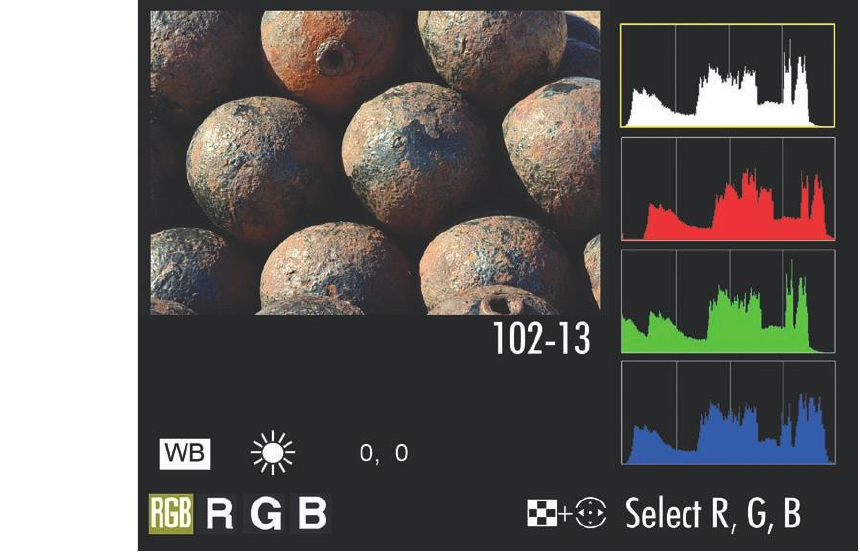
Figure 4.19
The D7000’s
most complete
histogram
screen shows
both lumi-
nance and sep-
arate red,
green, and blue
histograms.