11-3
User Guide for Cisco Secure Access Control System 5.3
OL-24201-01
Chapter 11 Monitoring and Reporting in ACS
Dashboard Pages
Note These tabs are customizable, and you can modify or delete the following tabs.
• General—The General tab lists the following:
–
Five most recent alarms—When you click the name of the alarm, a dialog box appears with the
details and the status of the alarm. You can update the information in the Status tab of this dialog
box to track the alarm. See Table 12-5 for a description of the fields in the Status tab.
–
Favorite reports—The favorite reports are displayed in alphabetical order. To view a report,
click the name of the report. You can view this report in the Interactive Viewer. You can
customize this list to include your favorite reports and can quickly launch them from the
dashboard.
• Troubleshooting—The Troubleshooting tab contains the following panes:
–
Live Authentications—View live authentications for the day. You can filter the records that
appear in this pane.
–
My Links—You can add your favorite links to this pane.
–
NAD Show Command—You can run any show command on any NAD device from this pane.
To run a NAD show command, you must:
a. Enter the IP address of the NAD (Required).
b. Enter the username and password for the NAD.
c. Choose the protocol, Telnet or SSHv2 (Required).
d. Enter the port number. The default is 23 (Required).
e. Enter the enable password.
f. Check the Use Console Server check box if you want to use the console server.
g. Enter the IP address of the console server—This field is required if you check the Use Console
Server check box.
h. Enter the show command that you want to run on the NAD (Required).
When the Monitoring & Report Viewer executes the NAD show command, it might sometimes
prompt you for additional details. See Table 14-5 for a description of the fields in the Progress
Details page. After you click Done, you can click Show Results Summary to view the result
as shown in Table 14-6.
–
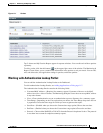
Authentication Lookup—You can use this portlet to run an authentication report with default
parameters, find authentication records for a user or MAC address, and run user or endpoint
summary report for a user or end point respectively. For more information on the Authentication
Lookup Portlet, see Working with Authentication Lookup Portlet, page 11-5.
• Authentication Trends—The Authentication Trends tab contains the following panes:
–
Authentication Trend—Provides a graphical and tabular representation of the authentication
trend for up to the past 30 days. In the graphical representation, the time is plotted on the X-axis
and the authentications are plotted on the Y-axis.
The tabular representation provides the number of passed, failed, and dropped authentications
for each day. The button at the lower-right corner of the chart ( )allows you to toggle
between the two views.
–
Top <N> Authentications—Provides a graphical representation of the top <N> authentications.
Time is plotted on the X-axis and authentications are plotted on the Y-axis.


