


13-62
User Guide for Cisco Secure Access Control System 5.3
OL-24201-01
Chapter 13 Managing Reports
Organizing Report Data
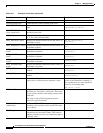
Step 7 For the second argument, type the number of days to add. In this case, type 7.
Step 8 Validate the expression, then click Apply.
The new calculated column appears in the report. For every value in the Order Date column, the
calculated column displays a date seven days later than the order date.
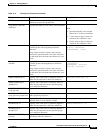
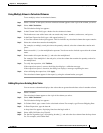
Subtracting Date Values in a Calculated Column
You can display the difference between two date values.
Step 1 Select a column.
In the report, the calculated column will appear to the right of the column you select.
Step 2 Select Add Calculation.
The Calculation dialog box appears.
Step 3 In Column Label, type a name for the calculated column.
For example, to subtract the actual shipping date from the date requested, type Shipping Delay.
Step 4 In Enter Expression, type the letter d.
A drop-down list appears, displaying functions that begin with d.
Step 5 Select DIFF_DAY(date1, date2).
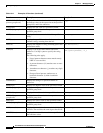
Step 6 For the first argument, type a left opening bracket ( [ ) and select the first date column from the
drop-down list.
For example, select Date Requested.
Step 7 For the second argument, type a left opening bracket ( [ ) and select the second date column from the
drop-down list.
For example, select Actual Shipping Date.
Step 8 Validate the expression, then click Apply.
The new calculated column appears in the report, displaying the difference between the two dates.
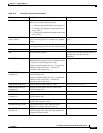
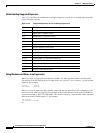
Working with Aggregate Data
Aggregating data involves performing a calculation over a set of data rows. For example, in a report that
has a column to calculate price*quantity, you can take the sum of all those calculations to obtain the total
price of all items. You can create up to three aggregations for a calculated column.
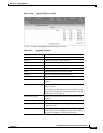
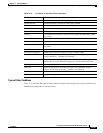
When you aggregate data, you choose whether the aggregation appears in the table header or footer. If
the column is a detail column in a data group, you can display the aggregate value in the group header
or footer. Figure 13-39 shows aggregate data in a group footer.