


13-75
User Guide for Cisco Secure Access Control System 5.3
OL-24201-01
Chapter 13 Managing Reports
Understanding Charts
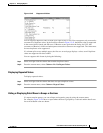
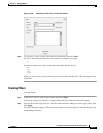
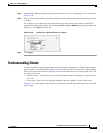
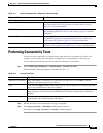
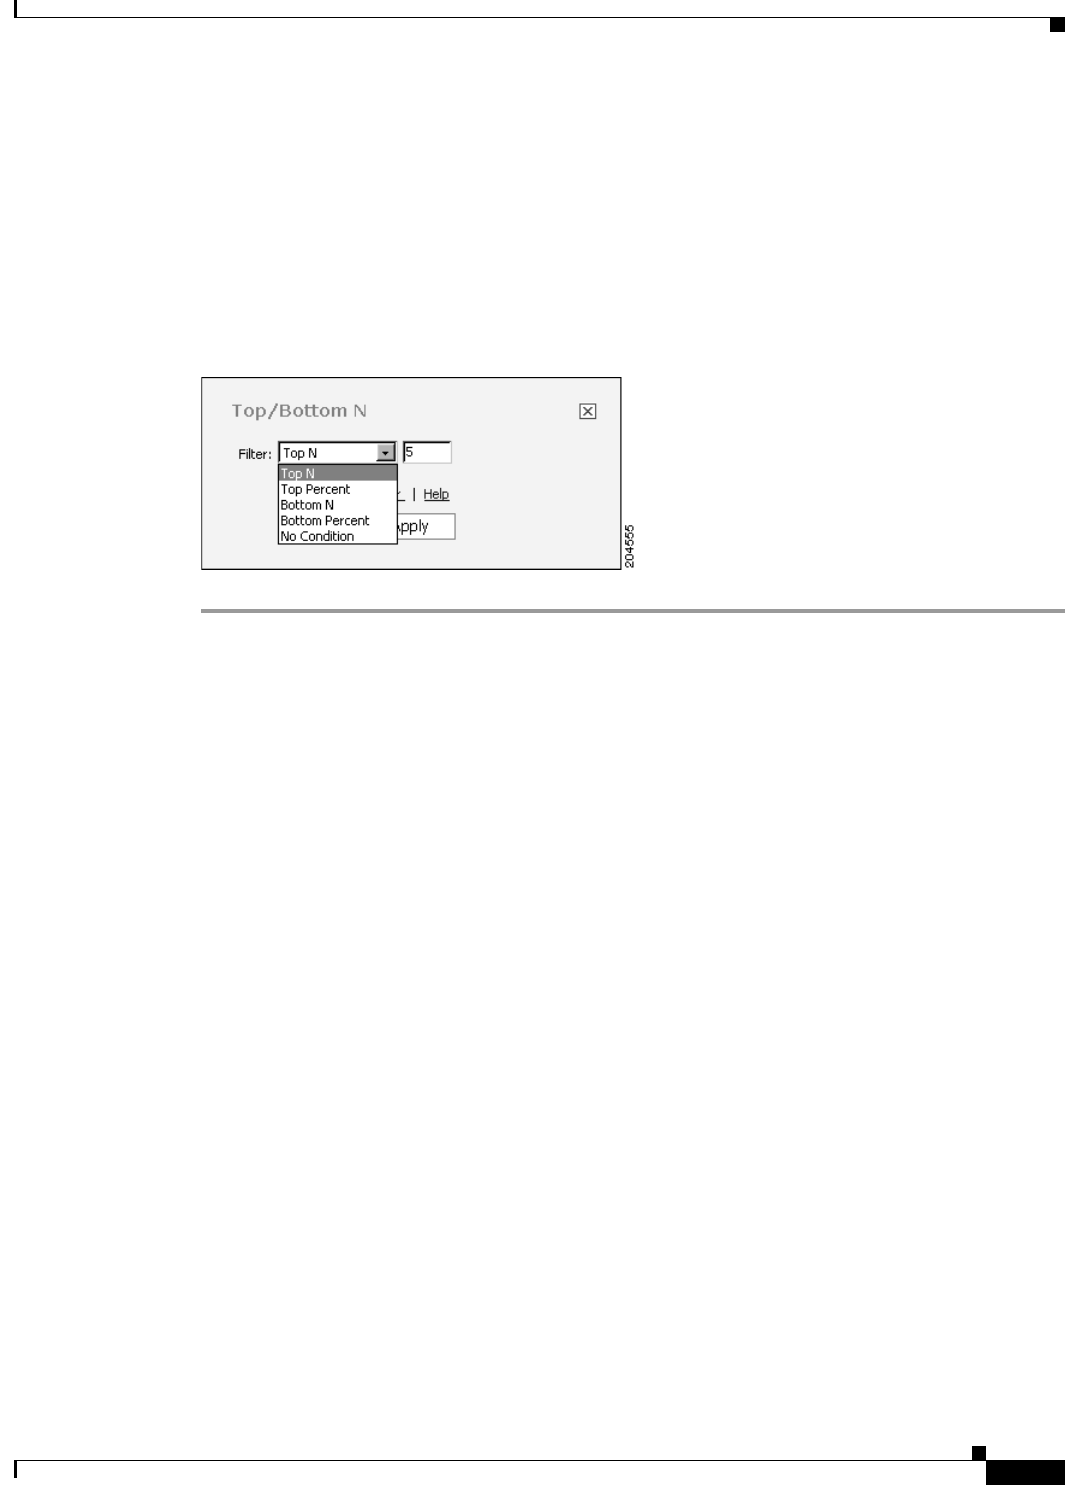
Step 2 From the Filter pulldown menu, select a particular number of rows or a percentage of rows, as shown in
Figure 13-48.
Step 3 Enter a value in the field next to the Filter pulldown menu to specify the number or percentage of rows
to display.
For example, to select the top 10 sales representatives by sales volume, after you have selected the
column that contains sales volume data and chosen Filter > Top or Bottom N, in the Top or Bottom N
dialog box, select Top N and enter 10.
Figure 13-48 Sorting Top or Bottom Values in a Column
Step 4
Click Apply.
Understanding Charts
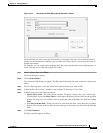
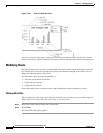
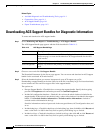
A chart is a graphical representation of data or the relationships among data sets. Charts display complex
data in an easy-to-assimilate format. Figure 13-49 shows the parts of a basic bar chart. A chart displays
data as one or more sets of points. The chart organizes data points into sets of values called series. The
two types of series are:
• Category series— The category series typically determines what text, numbers, or dates you see on
the x-axis.
• Value series—The value series typically determines the text, numbers, or dates on the y-axis.
In Figure 13-49, the category series contains a set of regions, and the value series contains a set of sales
figure values.