DescriptionOption
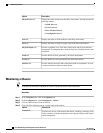
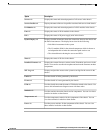
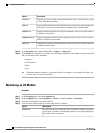
Displays the status and selected properties of all servers in the chassis.
Servers tab
Displays the status of the service profiles associated with servers in the chassis.
Service Profiles tab
Displays the status and selected properties of all IO modules in the chassis.
IO Modules tab
Displays the status of all fan modules in the chassis.
Fans tab
Displays the status of all power supply units in the chassis.
PSUs
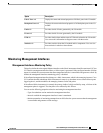
Displays detailed information about the connections between the chassis and
the fabric interconnects. The display has an icon for the following:
• Each fabric interconnect in the system
• The I/O module (IOM) in the selected component, which is shown as
an independent unit to make the connection paths easier to see
• The selected chassis showing the servers and PSUs
Hybrid Display tab
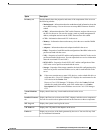
Displays the status of all slots in the chassis.
Slots tab
Displays the current firmware versions on the IO modules and servers in the
chassis. You can also use this tab to update and activate the firmware on those
components.
Installed Firmware tab
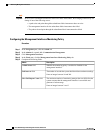
Displays and provides access to the system event logs for the servers in the
chassis.
SEL Logs tab
Provides details of faults generated by the chassis.
Faults tab
Provides details of events generated by the chassis.
Events tab
Provides details about and the status of FSM tasks related to the chassis. You
can use this information to diagnose errors with those tasks.
FSM tab
Provides statistics about the chassis and its components. You can view these
statistics in tabular or chart format.
Statistics tab
Provides temperature statistics for the components of the chassis. You can
view these statistics in tabular or chart format.
Temperatures tab
Provides power statistics for the components of the chassis. You can view
these statistics in tabular or chart format.
Power tab
Cisco UCS Manager GUI Configuration Guide, Release 2.0
OL-25712-04 649
Monitoring a Chassis


